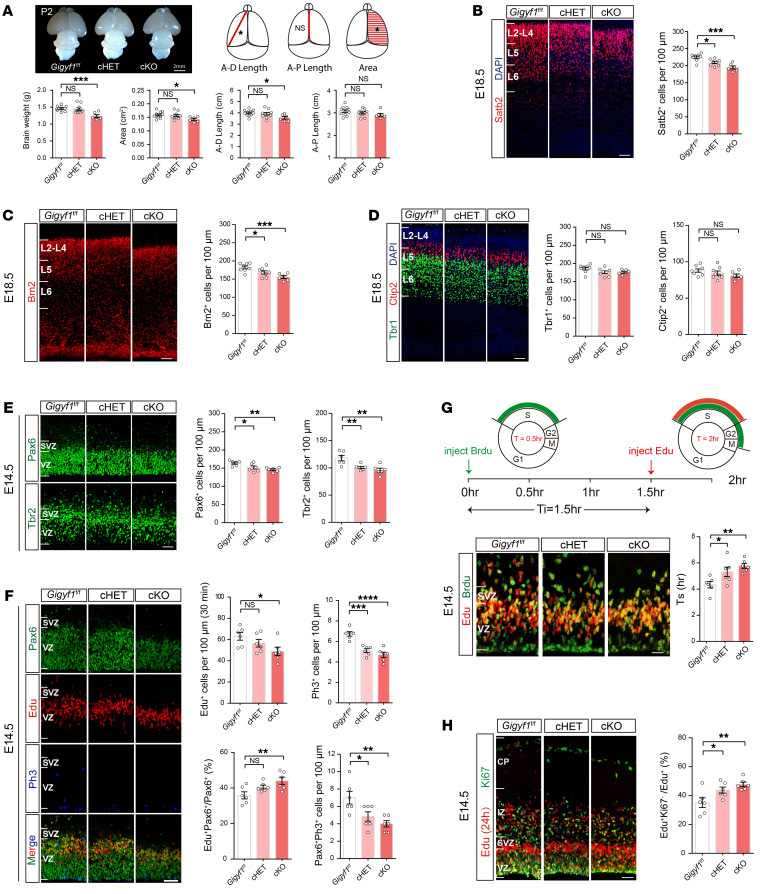
Figure 4. Gigyf1 disruption in the developing brain disturbs neurogenesis.
(A) Quantitative comparison of brain weight, cortical anterior-dorsal (A-D) length, anterior-posterior (A-P) length, and area in Gigyf1fl/fl (n = 11), cHET (n = 10), and cKO (n = 6) mice at P2. (B) Littermate cortices stained with Satb2 from Gigyf1fl/fl (n = 4), cHET (n = 4), and cKO (n = 3) mice at E18.5. Satb2+ cells per 100 μm of apical surface in L2–L4 were compared. (C) Littermate cortices stained with Brn2 from Gigyf1fl/fl (n = 4), cHET (n = 4), and cKO (n = 3) mice at E18.5. Brn2+ cells per 100 μm of apical surface in L2–L4 were compared. (D) Littermate cortices stained with Tbr1 and Ctip2 from Gigyf1fl/fl (n = 4), cHET (n = 4), and cKO (n = 3) mice at E18.5. Ctip2+ cells and Tbr1+ cells per 100 μm in L5 and L6 were compared. (E) Comparison of Pax6+ RGC (VZ) and Tbr2+ IPC (SVZ) populations per 100 μm of apical surface in Gigyf1fl/fl (n = 3), cHET (n = 3), and cKO (n = 3) mice at E14.5. (F) Comparison of Edu+ (SVZ) population, Ph3+ and Pax6+Ph3+ (VZ) population, Pax6+Edu+/Pax6+ proportion of apical surface from Gigyf1fl/fl (n = 3), cHET (n = 3), and cKO (n = 3) mice at E14.5. (G) Ki67 and Edu antibodies after 24 hour Edu pulse at E13.5. All cells that exited the cell cycles (Edu+/Ki 67–) were counted. The percentage of total Edu+ cells evaluated 24 hours after injection was analyzed. (H) S phase sequential labeling analysis of NPCs. EdU-Brdu double-stained cortical sections at E14.5 are shown. S phase durations were calculated (Ts=Ti/(Lcells/Scells)) and compared. All statistics were performed by 1-way ANOVA. Scale bars represent 50 μm. All data are represented as mean ± SEM. *P < 0.05, **P < 0.01, ***P < 0.001, ****P < 0.0001.

