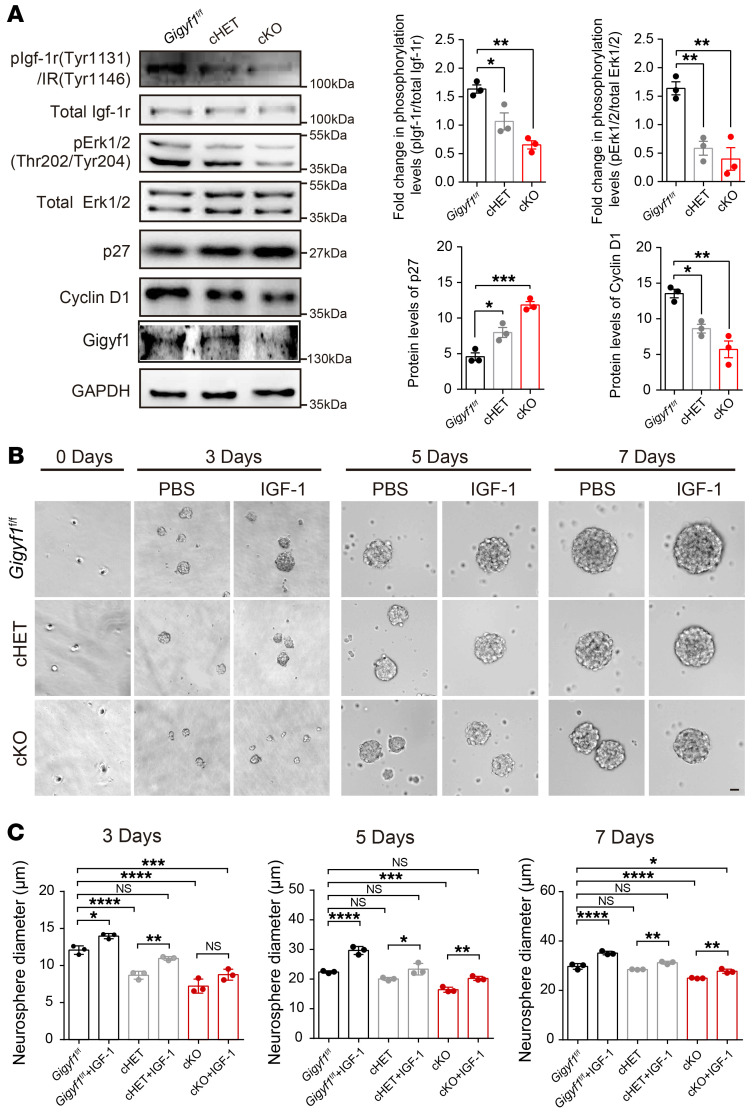
Figure 6. Dysregulation of IGF-1R/ERK signaling in Gigyf1 deficiency mice.
(A) Immunoblots of pIgf-1r, Igf-1r, pErk1/2, Erk1/2, p27, cyclin D1, and Gigyf1 in lysates from brain cortical tissue of Gigyf1fl/fl, cHET and cKO mice at E14.5. The relative levels of pIgf-1r/total Igf-1r, pErk-1r/total Erk, p27, and cyclin D1 were quantified by densitometry and compared using 1-way ANOVA. (B) Neurosphere formation assay. Neural progenitor cells are derived from Gigyf1fl/fl, cHET and cKO embryos. Representative images of Gigyf1fl/fl, cHET and cKO neurosphere are shown. Scale bar: 10 μm. (C) The diameters of Gigyf1fl/fl, cHET, and cKO neurospheres were calculated and compared. Experiments were performed for 3 trials and the statistics are based on the average of each condition from different trials. Statistical data are analyzed using 1-way ANOVA and 2-tailed t test. All data are represented as mean ± SEM. *P < 0.05, **P < 0.01, ***P < 0.001, ****P < 0.0001.

