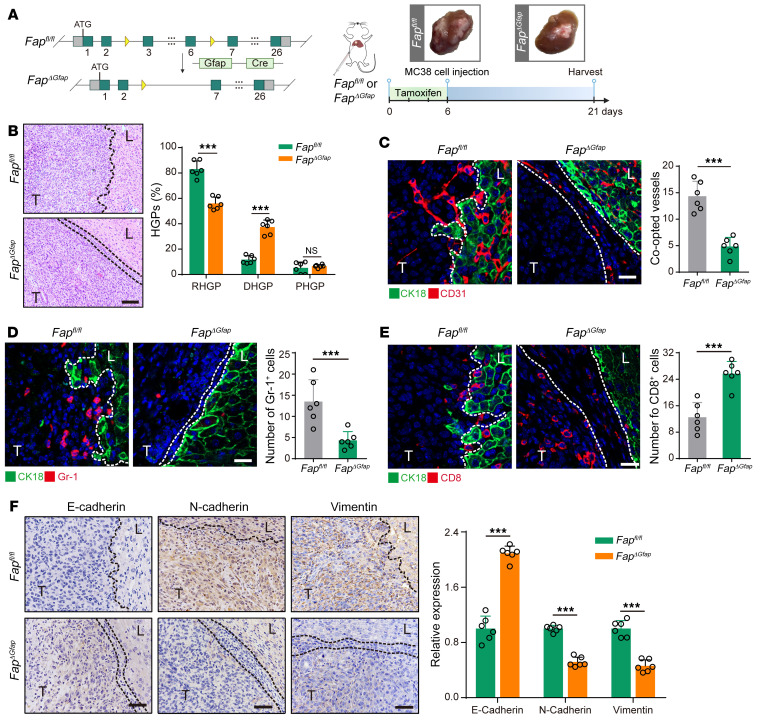
Figure 2. Conditional knockout of Fap in HSCs attenuates vessel co-option via inhibiting the recruitment of MDSCs, promoting the infiltration of CD8+ T cells, and suppressing tumor cell EMT.
(A) Schematic showing the strategy for generating HSC-specific Fap-knockout mice (FapΔGfap), and the experimental design of tamoxifen-induced HSC-specific Fap knockout in MC38 CRCLM allografts established in Fapfl/fl or FapΔGfap mice. Tumors were harvested and photographed at the end of experiments. (B) H&E staining of the tumor-liver interface of MC38 CRCLM allografts. Scale bar: 100 μm. Quantification of HGPs is shown (n = 6). (C) Immunofluorescence staining of liver parenchyma (CK18+, green) and CD31+ sinusoidal blood vessels (red) in the tumor-liver interface of MC38 CRCLM allografts. Scale bar: 20 μm. Quantification of the co-opted sinusoidal blood vessels is shown (n = 6). (D) Immunofluorescence staining of liver parenchyma (CK18+, green) and Gr-1+ MDSCs (red) in the tumor-liver interface of MC38 CRCLM allograft tumors. Scale bar: 20 μm. Quantification of Gr-1+ MDSCs is shown (n = 6). (E) Immunofluorescence staining of liver parenchyma (CK18+, green) and CD8+ T cells (red) in the tumor-liver interface of MC38 CRCLM allograft tumors. Scale bar: 20 μm. Quantification of CD8+ T cells is shown (n = 6). (F) Immunohistochemical staining and quantification of E-cadherin, N-cadherin, and vimentin in the tumor-liver interface of MC38 CRCLM allografts (n = 6). Dotted lines indicate the tumor-liver interface. Scale bars: 50 μm. T, tumor. L, liver. Data are presented as mean ± SEM. NS, no significance. ***P < 0.001 (2-tailed, unpaired t test).

