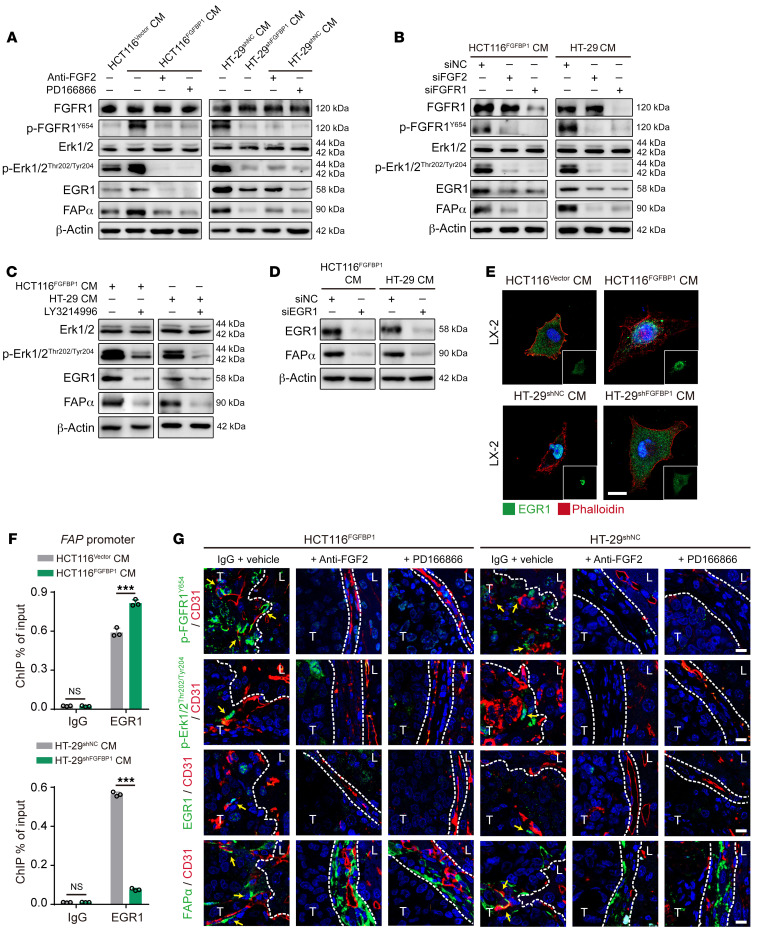
Figure 5. Tumor cell–derived FGFBP1 induces FAPα expression in HSCs via activating the FGF2/FGFR1/ERK1/-2/EGR1 axis.
(A) Western blotting analysis of FGFR1, p-FGFR1, ERK1/-2, p-ERK1/-2, EGR1, and FAPα in LX-2 cells treated with the conditioned medium from HCT116 or HT-29 cells in the absence or presence of FGF2-neutralizing antibody or PD-166866. (B) Western blotting analysis of FGFR1, p-FGFR1, ERK1/-2, p-ERK1/-2, EGR1, and FAPα in the FGF2- or FGFR1-knockdown LX-2 cells treated with conditioned medium from HCT116 or HT-29 cells. (C) Western blotting analysis of ERK1/-2, p-ERK1/-2, EGR1, and FAPα in LX-2 cells treated with the conditioned medium from HCT116 or HT-29 cells in the absence or presence of LY3214996. (D) Western blotting analysis of EGR1 and FAPα in EGR1-knockdown LX-2 cells treated with the conditioned medium from HCT116 or HT-29 cells. (E) Immunofluorescence staining for the location of EGR1 in LX-2 cells treated with the conditioned medium from HCT116 or HT-29 cells. Scale bar: 20 μm. (F) ChIP-qPCR analysis of the binding of EGR1 to the FAP promoter in LX-2 cells treated with the conditioned medium from HCT116 or HT-29 cells (n = 3). (G) Immunofluorescence staining of p-FGFR1, p-ERK1/-2, EGR1, or FAPα in HSCs (green) attached to the CD31+ sinusoidal blood vessels (red) in the tumor-liver interface of CRCLM xenografts (n = 6). Scale bars: 10 μm. Yellow arrows indicate the p-FGFR1+, p-ERK1/-2+, EGR1+, or FAPα+ HSCs. Dotted lines indicate the tumor-liver interface. LM, liver metastases; CM, conditioned medium; T, tumor; L, liver. Data are presented as mean ± SEM. NS, no significance. ***P < 0.001 (1-way ANOVA with Tukey’s post hoc comparison).

