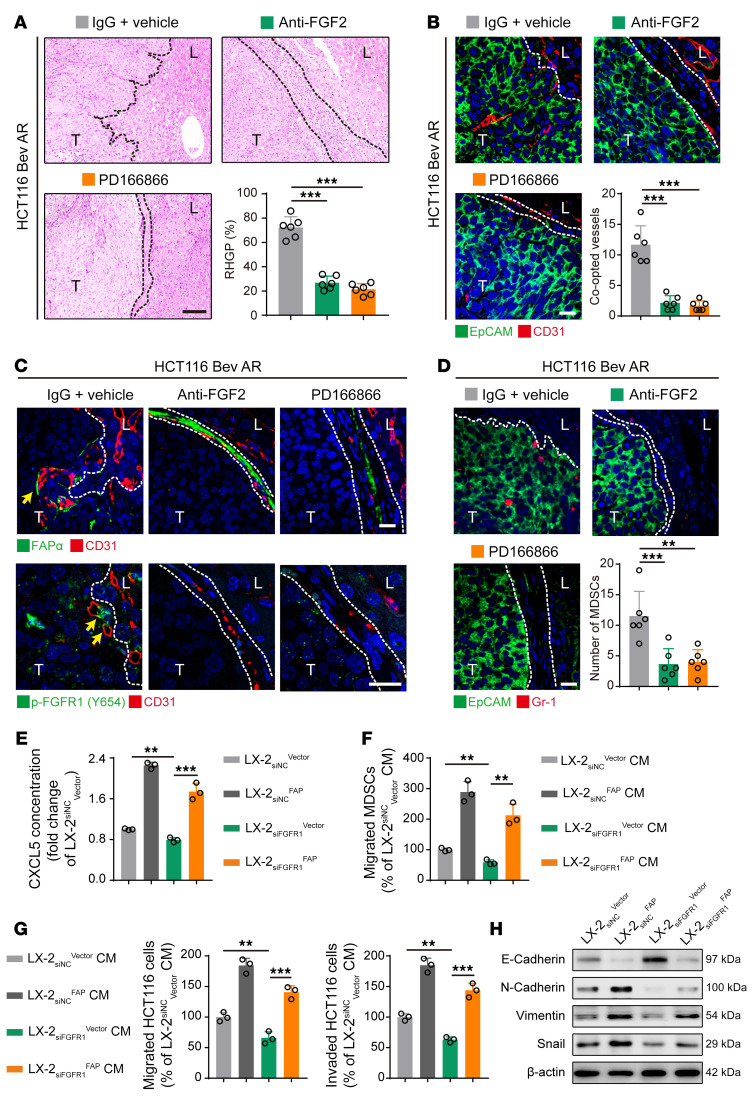
Figure 6. FGF2/FGFR1/FAPα axis is essential for the secretion of CXCL5 in HSCs, tumor cell EMT, and MDSC recruitment.
(A) H&E staining of the tumor-liver interface of HCT116 CRCLM xenografts. Scale bar: 100 μm. Quantification of RHGP is shown (n = 6). (B) Immunofluorescence staining of the EpCAM+ tumor cells (green) that infiltrated the liver parenchyma and hijacked the CD31+ sinusoidal blood vessels (red) in the tumor-liver interface of HCT116 CRCLM xenografts. Scale bar: 20 μm. Quantification of the co-opted sinusoidal blood vessels is shown (n = 6). (C) Immunofluorescence staining of FAPα+ (green) or p-FGFR1+ (green) HSCs attached to the CD31+ sinusoidal blood vessels (red) in the tumor-liver interface of HCT116 CRCLM xenografts. Scale bars: 20 μm. (D) Immunofluorescence staining of the EpCAM+ (green) tumor cells and Gr-1+ MDSCs (red) in the tumor-liver interface of HCT116 CRCLM xenografts. Scale bar: 20 μm. Quantification of the Gr-1+ MDSCs is shown (n = 6). (E) ELISA analysis of CXCL5 concentration in the culture medium of LX-2 cells. (F) Transwell assay for the migration of MDSCs treated with the conditioned medium from LX-2 cells (n = 3). (G) Transwell assays for the migration and invasion of HCT116 cells treated with the conditioned medium from LX-2 cells (n = 3). (H) Western blotting analysis of E-cadherin, N-cadherin, vimentin, and snail in HCT116 cells treated with the conditioned medium from LX-2 cells. Dotted lines indicate the tumor-liver interface. Bev AR, bevacizumab acquired resistance; CM, conditioned medium; T, tumor; L, liver. Data are presented as mean ± SEM. **P < 0.01; ***P < 0.001 (1-way ANOVA with Tukey’s post hoc comparison).

