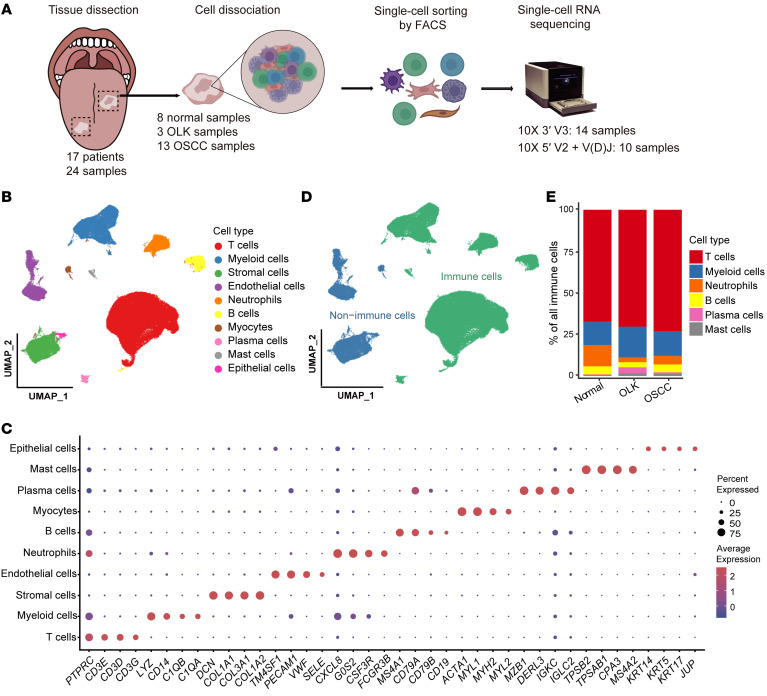
Figure 1. Single-cell transcriptomic landscape of adjacent normal, OLK, and OSCC tissues.
(A) Overview of the workflow and the experimental design for scRNA-Seq. (B) UMAP plot showing the clustering results of 10 major cell types for 131,702 high-quality single cells from adjacent normal, OLK, and OSCC tissues. The colors represent the major cell types. (C) Dot plot showing the highly expressed marker genes in each major cell type. The dot size represents the percentage of cells expressing the marker genes in each major cell type, and the dot color represents the average expression level of the marker genes in each cell type. Red indicates high expression, and blue indicates low expression. (D) UMAP plot showing the distribution of immune and nonimmune cells among all cells. Green indicates immune cells, and blue indicates nonimmune cells. (E) Stacked histogram showing the percentages of immune cell types among total immune cells from adjacent normal, OLK, and OSCC tissues.

