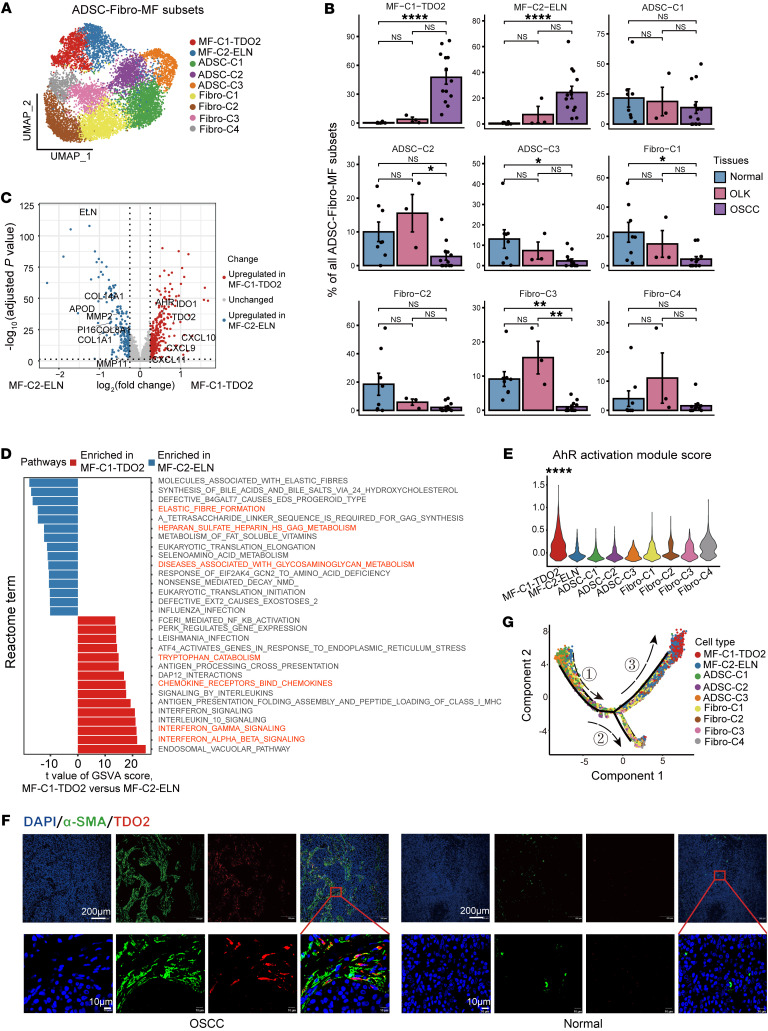
Figure 4. Subsets of ADSC-Fibro-MF cells and a subtype of myofibroblasts expressing TDO2 in OSCC.
(A) UMAP plot showing the distribution of ADSC-Fibro-MF subsets, with each color representing a cell subset. (B) Bar plots showing the percentage of ADSC-Fibro-MF subsets among total ADSC-Fibro-MF cells in adjacent normal, OLK, and OSCC tissues. *P < 0.05,**P < 0.01, and ****P < 0.0001, by Kruskal-Wallis test followed by Bonferroni’s multiple-comparison test. (C) Volcano plot showing differentially expressed genes between MF-C1-TDO2 and MF-C2-ELN. Red dots represent genes that were significantly upregulated in MF-C1-TDO2 [log2(fold change) >1, adjusted P < 0.05]; blue dots represent genes that were significantly upregulated in MF-C2-ELN [log2(fold change) <–1, adjusted P < 0.05]; and gray dots represent genes with no significant difference. (D) Bar plot showing the top 15 highest differential pathways between MF-C1-TDO2 and MF-C2-ELN. Red bars represent pathways that were enriched in MF-C1-TDO2, and blue bars represent pathways that were enriched in MF-C2-ELN. (E) Violin plot showing the score for the AhR activation module among ADSC-Fibro-MF subsets. ****P < 0.0001, by Wilcoxon rank-sum test. (F) IF staining images showing the expression intensity of α-SMA (green) and TDO2 (red) in OSCC and normal adjacent tissue. Images in the first row were obtained at ×10 magnification (scale bars: 200 μm). Images in the second row were obtained at ×40 magnification (scale bars: 10 μm). (G) UMAP plot showing the differentiation trajectory of ADSC-Fibro-MF cells and the distribution of each cell subset on the trajectory. Branch 1 is mainly composed of ADSCs, branch 2 is mainly composed of fibroblasts, and branch 3 is mainly composed of myofibroblasts. The numbers indicate the branches.

