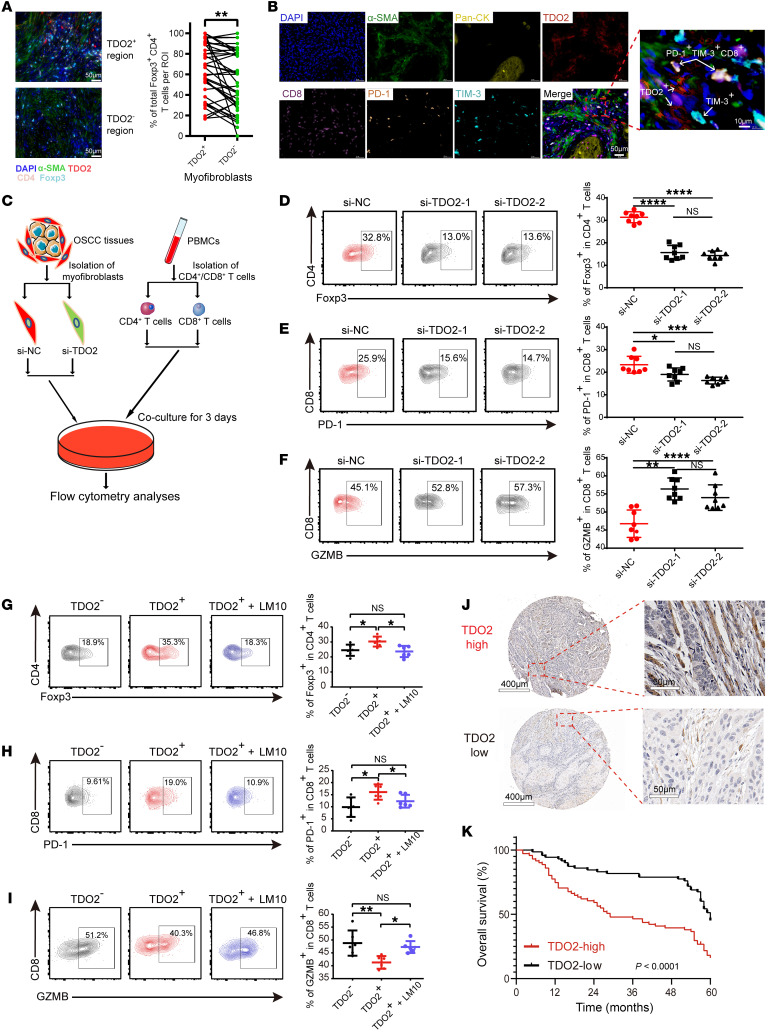
Figure 6. TDO2+ myofibroblasts mediate T cell suppression.
(A) Representative images (Pt14_Ca) (left) and quantitative analyses (right) showing the spatial distribution and the proportions of Foxp3+CD4+ T cells (light blue) around TDO2+ (red) and TDO2– (green) myofibroblasts (radius <50 μm). Scale bars: 50 μm. (B) Representative images (Pt14_Ca) showing the spatial distribution of PD-1+TIM-3+CD8+ T cells around TDO2+ myofibroblasts. Scale bars: 50 μm and 10 μm (enlarged inset). (C) Schematic diagram depicting the coculture strategy for control myofibroblasts (si-NC) and TDO2-knockdown myofibroblasts (si-TDO2) with CD4+ or CD8+ T cells. (D–F) Representative images of flow cytometry (left) and statistical results (right) showing the proportions of (D) Foxp3+CD4+ T cells, (E) PD-1+, and (F) GZMB+CD8+ T cells for the control group (si-NC) and the TDO2-knockdown groups (si-TDO2-1 and si-TDO2-2). (G–I) Representative flow cytometry (left) and statistical results (right) showing the proportion of (G) Foxp3+ T cells, (H) PD-1+, and (I) GZMB+CD8+ T cells after 3 days of coculturing with TDO2– or TDO2+ myofibroblasts or with TDO2+ myofibroblasts plus the TDO2 inhibitor LM10. (J) Representative IHC images of TMAs. The H scores of representative TDO2hi and TDO2lo images were 141.9 and 68.0, respectively. Scale bars: 400 μm (left) and 50 μm (right). (K) OS curve between TDO2hi (n = 71) and TDO2lo (n = 71) cohorts of patients with OSCC according to the staining intensity of IHC images. P < 0.0001, by log-rank test. (A and D–I) *P < 0.05, **P < 0.01, ***P < 0.001, and ****P < 0.0001, by 1-way ANOVA followed by Bonferroni’s multiple-comparison test.

