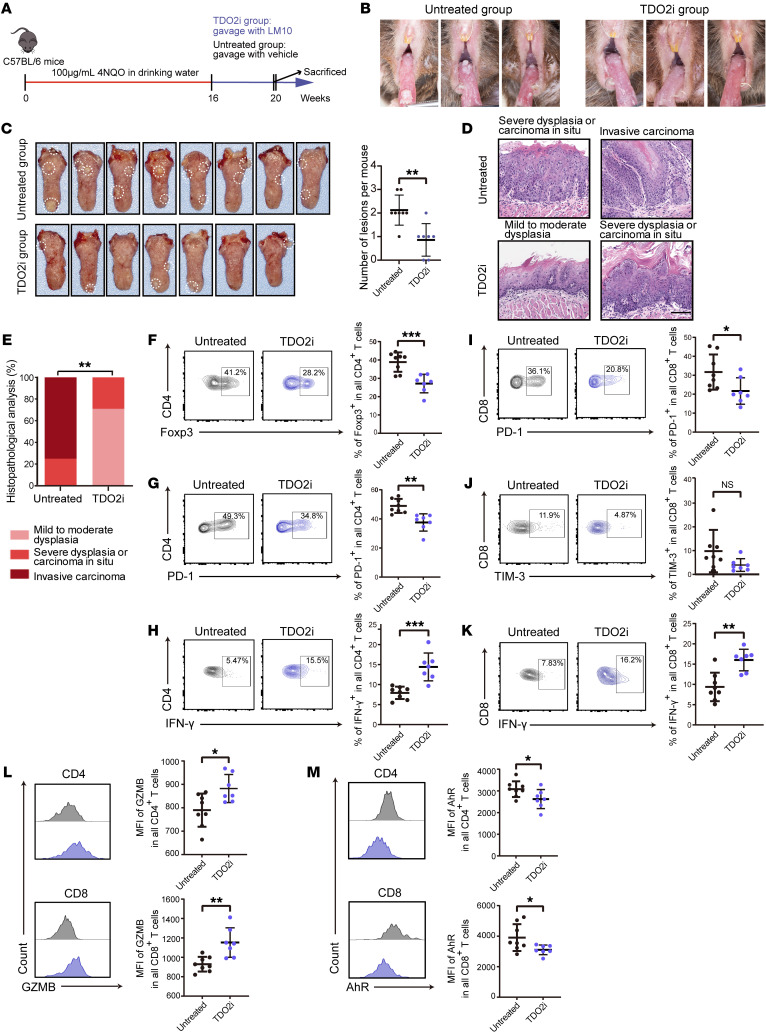
Figure 7. Inhibition of TDO2 prevents the formation of OSCC in 4NQO-induced carcinogenic murine models.
(A) Schematic plot showing the induction of OSCC by 4NQO in C57BL/6 mice and the administration strategies for the TDO2i group (n = 7) and the untreated group (n = 8). (B) Six representative intraoral lesions on the tongues of mice in the TDO2i and untreated groups. (C) Macroscopic lesions on the tongues (left) and statistical results (right) for mice in the TDO2i and untreated groups. The dotted circles indicate macroscopic cauliflower-like lesions. (D) Representative microscopic images of the TDO2i and untreated groups following H&E staining. Scale bar: 100 μm. (E) Comparison of the tongue lesions (mild-to-moderate dysplasia, severe dysplasia or carcinoma in situ, and invasive carcinoma) in mice from the TDO2i and untreated groups. **P < 0.01, by Fisher’s exact test. (F–H) Representative flow cytometry (left) and statistical results (right) showing the proportions of (F) Foxp3+, (G) PD-1+ and (H) IFN-γ+CD4+ T cells for the TDO2i and untreated groups. (I–K) Representative flow cytometry (left) and statistical results (right) showing the proportions of (I) PD-1+, (J) TIM-3+, and (K) IFN-γ+CD8+ T cells for the TDO2i and untreated groups. (L and M) Representative flow cytometry (left) and statistical results (right) showing the median fluorescence intensity (MFI) of (L) GZMB and (M) AhR for CD4+ (upper) and CD8+ (lower) T cells from the TDO2i and untreated groups. *P < 0.05, **P < 0.01, and ***P < 0.001, by 2-tailed Student’s t test (C and E–M).

