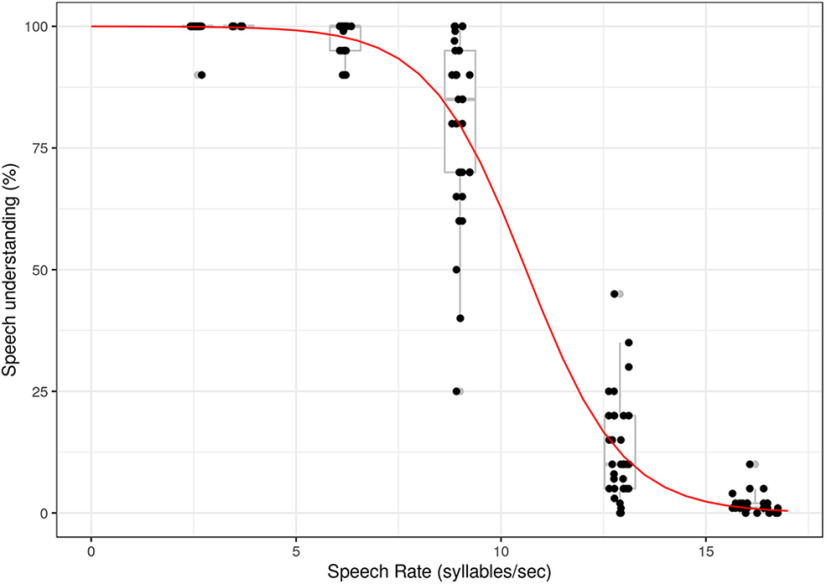
Figure 2.
Rated speech understanding in function of speech rate. Dots represent speech understanding per participant for every participant-specific speech rate. Boxplots represent the participants' results for the averaged speech rates. Red line indicates the sigmoid function fitted on the data over participant.

