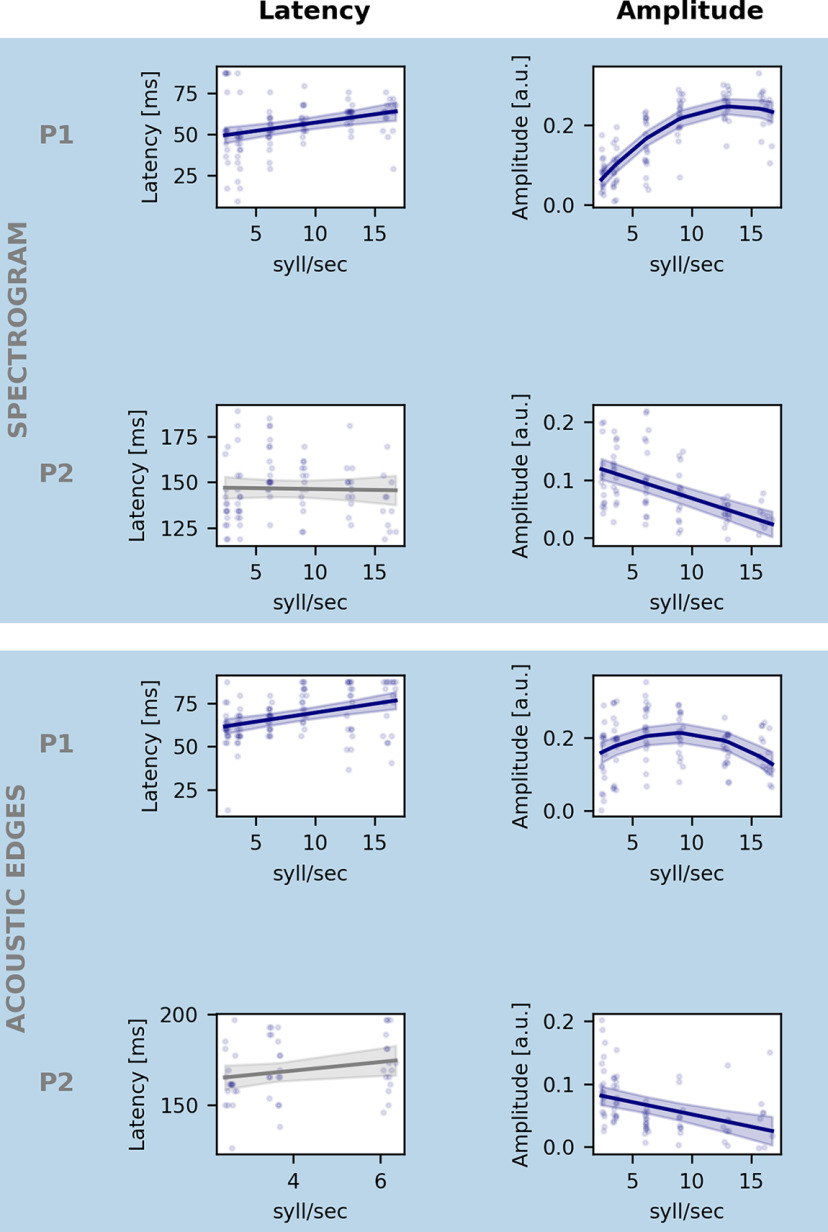
Figure 4.
Effect of speech rate on the amplitude and latency of acoustic representation. Each row represents the effect of speech rate on latency (left) and the amplitude (right) of the neural response to spectrogram (top row) and acoustic edges (bottom row) for, respectively, the first (P1) and second (P2) identified peak as indicated in Figure 3. Blue line indicates the model's prediction for each speech rate. Shaded area represents the CI of the model's prediction. Gray represents the nonsignificant models. We only include the latency of significant peaks for the latency analysis.

