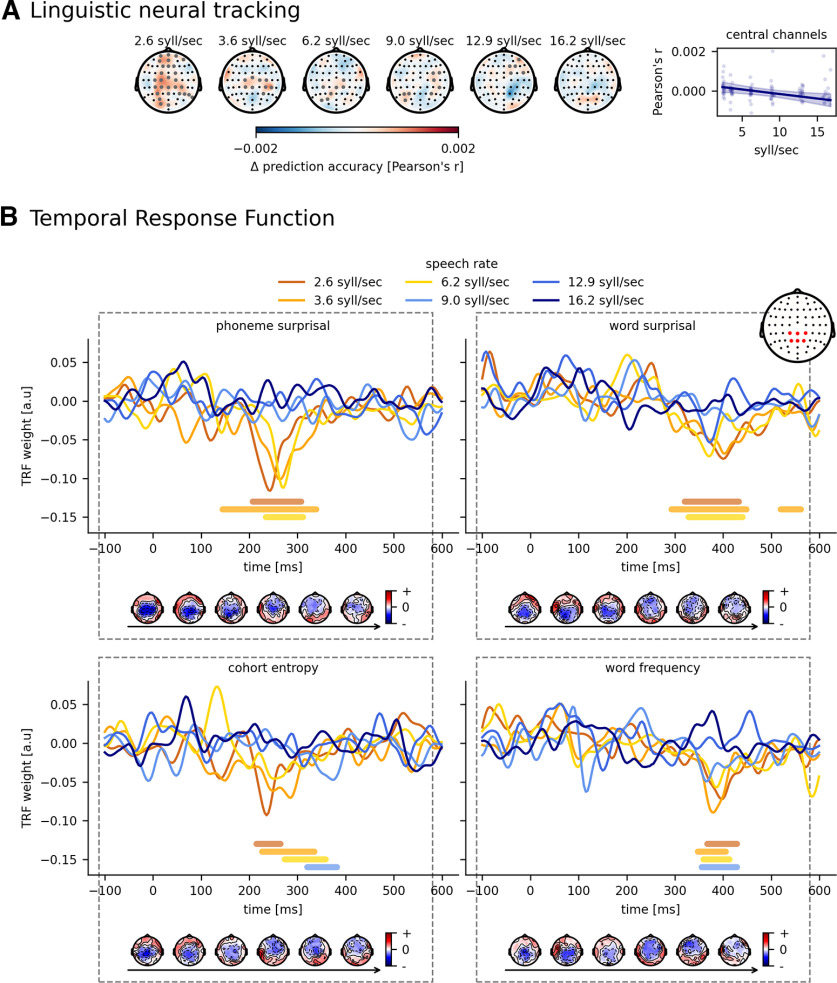
Figure 5.
Effect of speech rate on linguistic tracking. A, Visualization of the added value of linguistic representations across participants for each speech rate. Annotated gray channels represent the cluster that drives the significant difference from 0. Right, How linguistic tracking, averaged across central channels, changes according to the speech rate. B, The associated normalized TRFs for the linguistic representations. Bold horizontal lines indicate where the TRFs are significantly different from 0 (the same color as the TRF of the considered speech rate). The topographies below represent the associated peak topographies to the TRF. Horizontal arrow underneath the topographies indicates the increasing speech rate.

