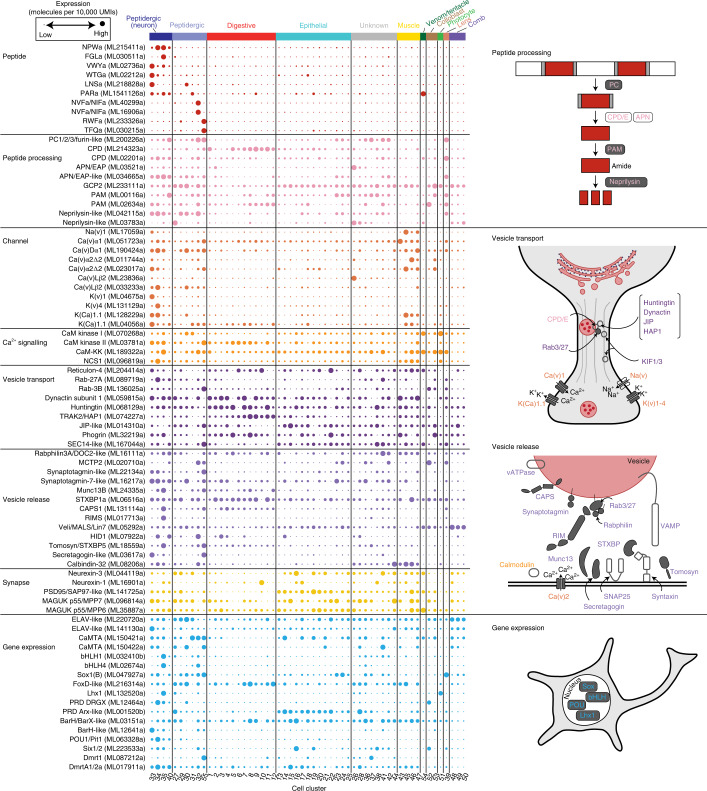
Fig. 3. Genetic signature of peptidergic cells in the ctenophore M. leidyi.
Expression of gene homologues involved in peptidergic neuronal function across the different cell clusters of M. leidyi based on scRNA-seq data12. The dot plot shows the normalized expression values (molecules per 10,000 UMIs) scaled by gene. Dot size from smallest to largest corresponds to lowest and highest expression, respectively. The genes with highest expression in each gene family were selected (Methods). Dots are coloured according to gene functional categories. Schematic representations of the major functional modules required for peptidergic signalling are shown on the right side. The molecules abundantly expressed in the peptidergic clusters are shown in grey.

