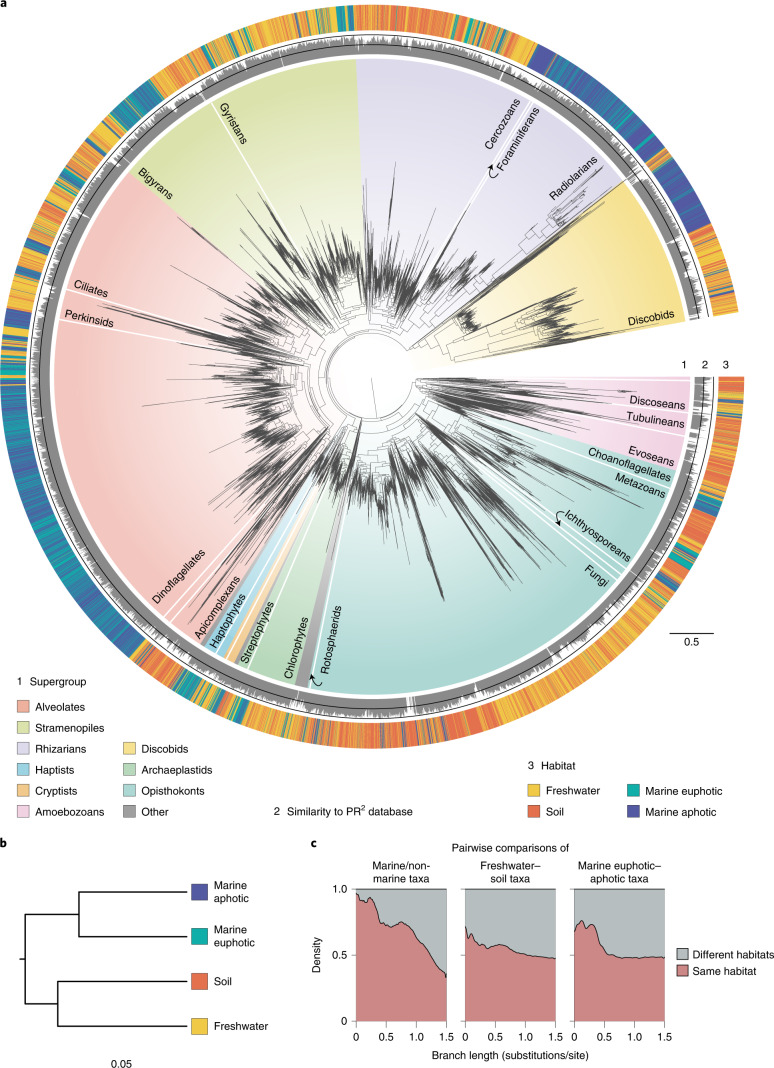
Fig. 1. Global eukaryotic 18S–28S phylogeny from environmental samples and the distribution of habitats.
a, This tree corresponds to the best maximum-likelihood tree inferred using an alignment with 7,160 sites and the GTRCAT model in RAxML99. The tree contains 16,821 OTUs generated from PacBio sequencing of 21 environmental samples (no reference sequences were included). Ring no. 1 around the tree indicates taxonomy of the environmental sequences, with all major eukaryotic lineages considered in this study labelled. Ring no. 2 depicts percentage similarity with the references in the PR2 database as calculated using BLAST and was set with a minimum of 70% with the two black lines in the middle indicating 85% and 100% similarity levels. Ring no. 3 depicts the habitat origin of each OTU. b, Hierarchical clustering of the four habitats based on a phylogenetic distance matrix generated using the unweighted UniFrac method (n = 7, n = 5, n = 4 and n = 5 samples for soil, freshwater, marine euphotic and marine aphotic, respectively). All communities were found to differ significantly from each other using Monte Carlo simulations (Bonferroni-adjusted P < 0.001). c, Stacked density plot of branch lengths between taxa pairs from the same or different habitats (n = 14,977,604 taxa pairs with a maximum patristic distance of 1.5 substitutions/site). Note that this plot should be interpreted with caution as taxa pairs do not represent independent datapoints due to phylogenetic relatedness.

