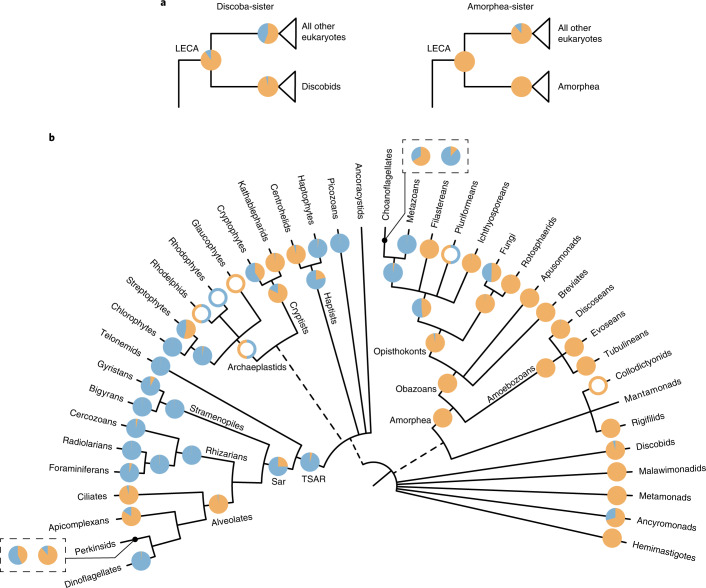
Fig. 4. Ancestral states of major eukaryotic clades as estimated by BayesTraits on a set of 100 global PacBio phylogenies.
Pie charts at each node indicate the posterior probabilities of likelihoods for the character states as follows: blue, marine; orange, non-marine. Nodes with empty circles indicate wherever there was insufficient taxon sampling to infer ancestral habitats but a reasonable estimate could be made from existing literature (Supplementary Note 3). a, Ancestral habitat of the LECA as inferred using two different roots. b, Ancestral states of major eukaryotic lineages. For the two cases where the incorporation of Illumina data inferred a different likely ancestral state, the results are shown in boxes. The pie chart on the right was obtained using the global eukaryotic phylogeny, while the pie chart on the left was obtained from clade-specific phylogenies. The tree is adapted from ref. 29.

