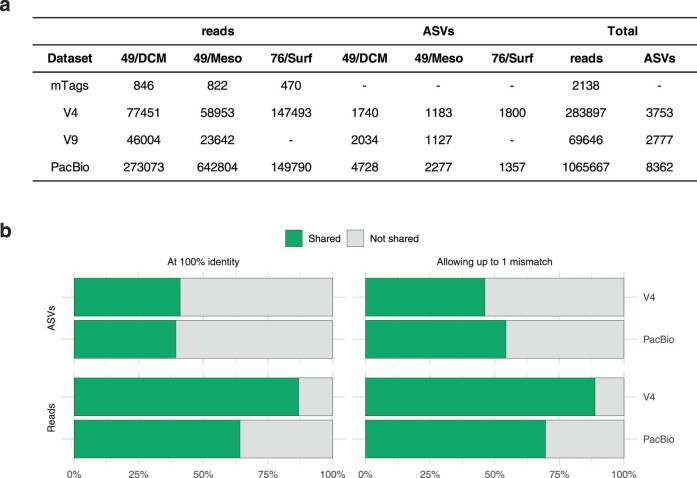
Extended Data Fig. 1. Shared ASVs between PacBio and Illumina sequencing.
Comparison of PacBio and Illumina sequencing. PacBio amplicons were compared with metagenomes (mTags), V4 amplicons, and V9 amplicons from three marine samples corresponding to the pico size fraction from the Malaspina expedition27. Station 76|Surface did not have V9 amplicon data. ASVs = Amplicon Sequence Variants. (a) Number of reads and ASVs for each sample for each marker. The mTags represent sequence length of ca. 100 bp, so no ASV level is available, as this short length does not give enough resolution. More PacBio sequences were generated for each sample compared to Illumina sequences. (b) Comparison of PacBio ASVs (that is de-noised, preclustered sequences) with the ones given by V4 amplicons. A similar comparison with V9 ASVs was not carried out as not all samples had V9 Illumina data available. Around half of the sequences were shared, which represented the majority of reads.

