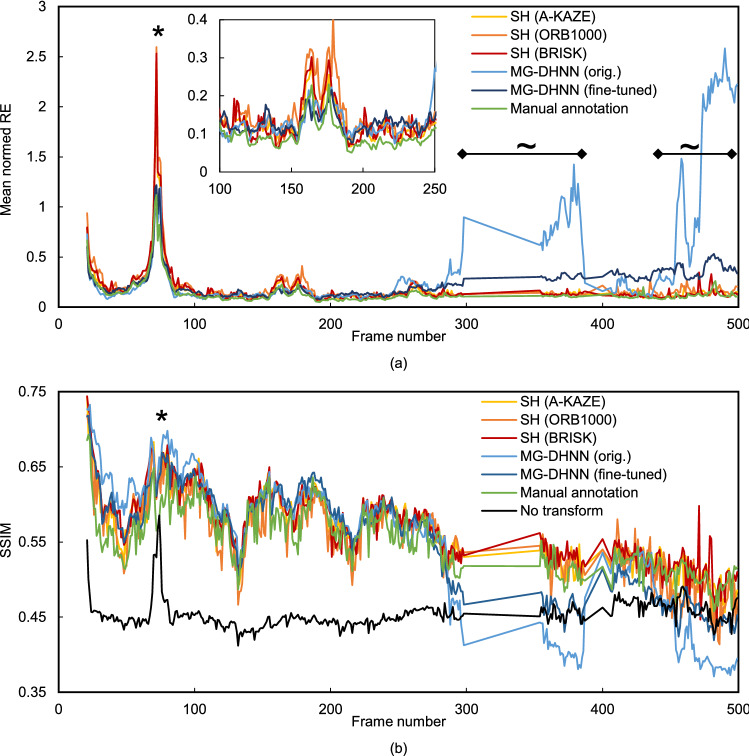
Figure 5.
(a) Mean normalized RE and (b) SSIM of start frame 20 and all consecutive frames with more than 15 corresponding manual annotations. Mean normalized RE and SSIM are shown for single homography estimation (A-KAZE, ORB1000, BRISK, and manual annotation) and MG-DHNN (original and fine-tuned). Additionally, SSIM is shown without any applied transformation. Frames labeled with * are very similar to the start frame and show a high SSIM without transformation. The mean normalized RE shows higher values for these frames because of the very small moved distances of the manual annotations. However, the SSIM of the transformed frames is still higher than without transformation. Frames labeled with ~ include tissue deformations caused by surgical instruments. From frame number 390 on, large parts of the image are partially occluded by two instruments in the field of view.

