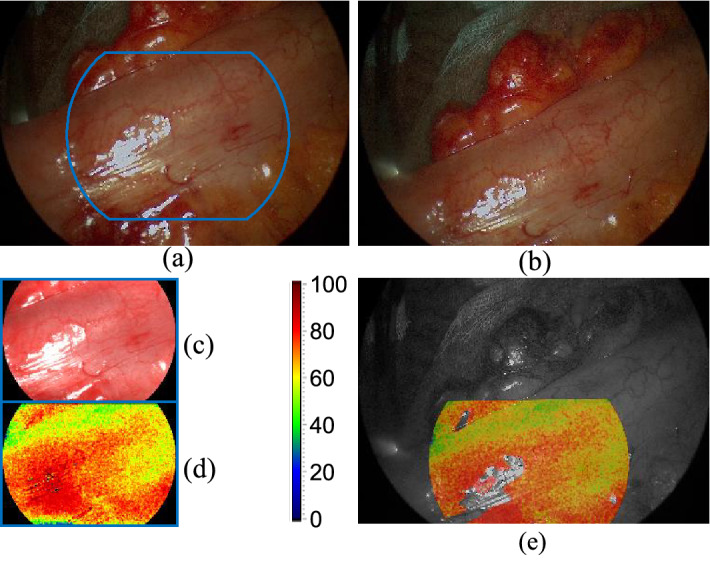
Figure 7.

Augmentation of in-vivo video data with HSI. (a) Start frame from the color sensor acquired during the HSI record. The blue outline indicates the region visible in HSI. (b) An exemplary target frame of the video, 20 s after HSI was performed. (c) Pseudocolor image reconstructed from hyperspectral data. (d) Static color map representing the tissue oxygenation according to the color scale. (e) Semitransparent overlay of the oxygenation map and the grayscale of the target frame after registration and postprocessing.
