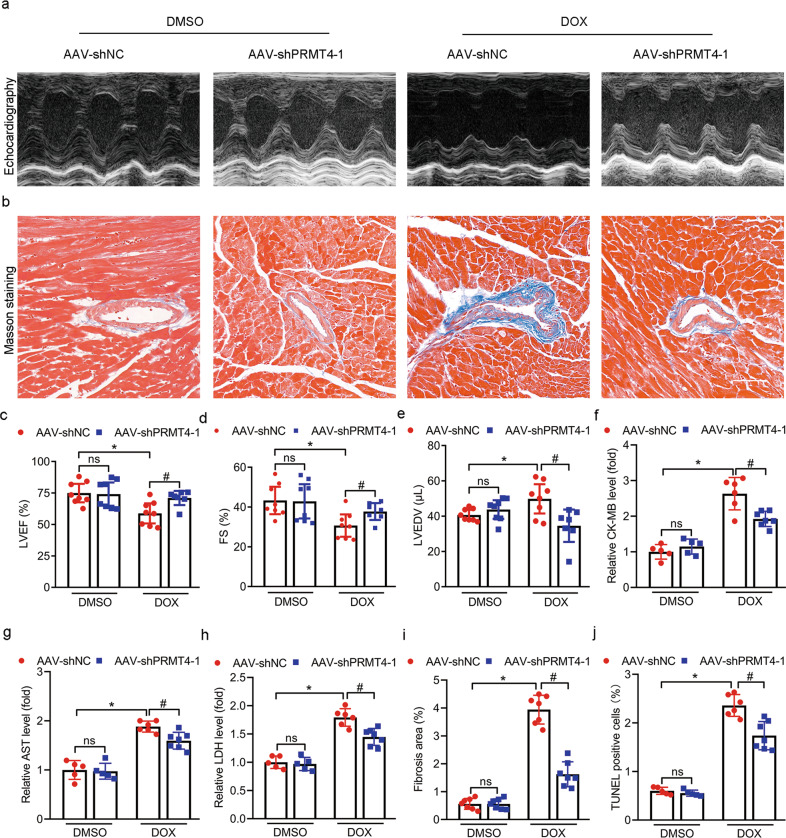
Fig. 3. PRMT4 disruption alleviates DIC in vivo.
AAV-shNC or AAV-shPRMT4 were applied via tail vein injection and the DIC model was established 14 days later a Representative images of M-mode echocardiograms; b Representative Masson staining images. c–e Quantitative analysis of LVEF (c, *P < 0.01, #P < 0.05), FS (d, *P < 0.01, #P < 0.05), and LVEDV (e, *P < 0.05, #P < 0.05) by echocardiography; f–h Quantitative analysis of serum CK-MB (f, *P < 0.001, #P < 0.01), AST (g, *P < 0.001, #P < 0.01), and LDH (h, *P < 0.001, #P < 0.01); i Quantitative analysis of fibrosis area, *P < 0.001, #P < 0.001; j Quantitative analysis of TUNEL positive cells by immunofluorescence staining, *P < 0.001, #P < 0.01.

