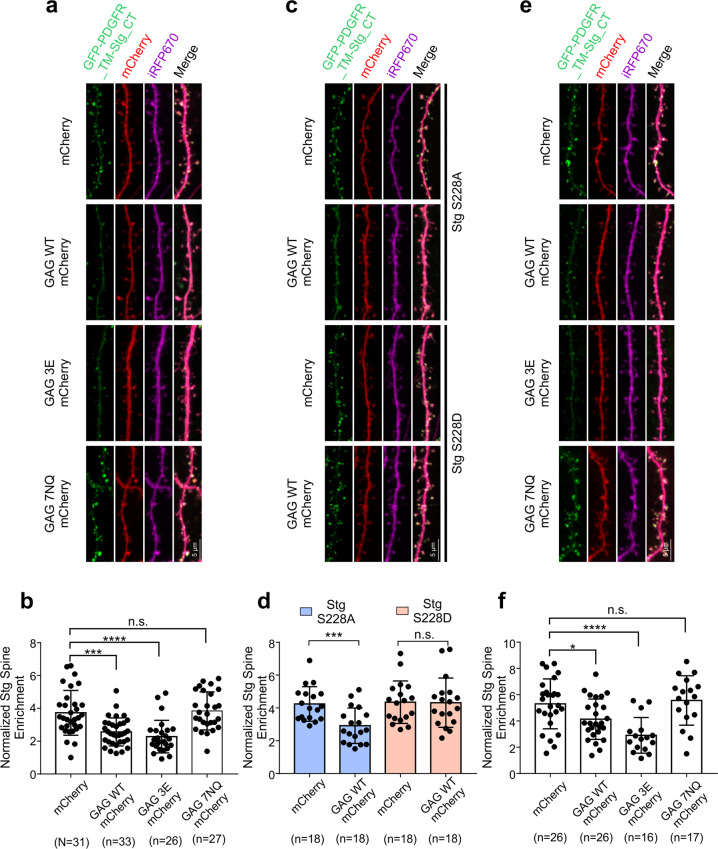
Fig. 8. The GAG domain of Arc is sufficient in dispersing Stargazin clusters in synapses.
a Representative confocal images of cultured mouse hippocampal neurons expressing GFP-PDGFR-TM-Stg_CT WT, iRFP670 (as the cell fill), and mCherry or individual mCherry-tagged GAG WT, GAG 3E and GAG 7NQ, respectively. b Quantification of averaged GFP-PDGFR-TM-Stg_CT spine/shaft intensity ratios normalized with iRFP670 in mice hippocampal neurons expressing individual Arc constructs. Error bars indicate ± SEM. One-way ANOVA followed by Tukey’s post hoc test, “n” equals number of neurons with 20–30 spines per neuron, ***P < 0.001, **P < 0.01, *P < 0.05. c Representative confocal images of cultured mouse hippocampal neurons expressing GFP-PDGFR-TM-Stg_CT S228A (up) or S228D (down), iRFP670, and mCherry or GAG-mCherry. d Quantification of averaged GFP-PDGFR-TM-Stg_CT S228A or S228D spine/shaft intensity ratios normalized with iRFP670 in mice hippocampal neurons expressing mCherry or GAG-mCherry. Error bars indicate ± SEM. One-way ANOVA followed by Tukey’s post hoc test, “n” equals number of neurons with 20–30 spines per neuron, ***P < 0.001, **P < 0.01, *P < 0.05. e Representative confocal images of cultured mouse hippocampal neurons expressing GFP-PDGFR-TM-Stg_CT WT, iRFP670, PSD-95, and mCherry or individual mCherry-tagged GAG WT, GAG 3E and GAG 7NQ, respectively. f Quantification of averaged GFP-PDGFR-TM-Stg_CT spine/shaft intensity ratios normalized with iRFP670 in mice hippocampal neurons expressing individual Arc constructs. Error bars indicate ± SEM. One-way ANOVA followed by Tukey’s post hoc test, “n” equals number of neurons with 20–30 spines per neuron, ***P < 0.001, **P < 0.01, *P < 0.05.

