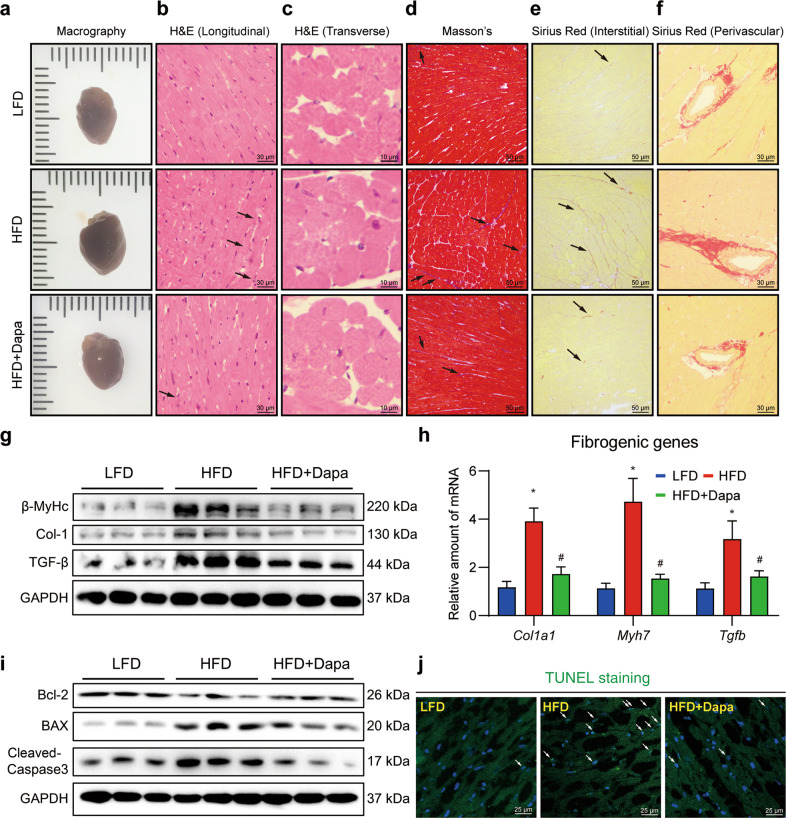
Fig. 5. Dapa attenuates HFD-induced cardiac fibrosis, remodeling and cardiomyocytes apoptosis.
Mice were randomly divided into 3 groups, including LFD, HFD and HFD + Dapa. After 3 months of high fat diet, mice were treated with 1 mg·kg−1·d−1 Dapa for another 2 months in HFD + Dapa group. a Representative macrographs of hearts from different groups of mice. Hematoxylin-eosin staining of heart sections. Representative images of longitudinal views (b, scale bar = 30 μm) and transverse views (c, scale bar = 10 μm). d Representative images of Masson’s staining of heart sections (scale bar = 50 μm). Sirius Red staining of heart sections. Representative images of interstitial views (e, scale bar = 50 μm) and perivascular views (f, scale bar = 30 μm). g Western blot analysis of fibrotic and hypertrophy protein markers in heart tissue. GAPDH was used as loading control. h Quantitative PCR analysis of fibro-genic genes in heart tissue, and β-actin was used as normalization control. i Western blot analysis of apoptotic protein markers in heart tissue. GAPDH was used as loading control. j Representative images of TUNEL staining of heart sections. White arrows showed positive TUNEL staining cells in heart tissue (scale bar = 25 μm). n = 8 (a-f, h, j), n = 6 (g, i); Means ± SEM; One-way ANOVA followed by Turkey post-hoc tests; *P < 0.05, compared with LFD group, #P < 0.05, compared with HFD group.

