Figure 7.
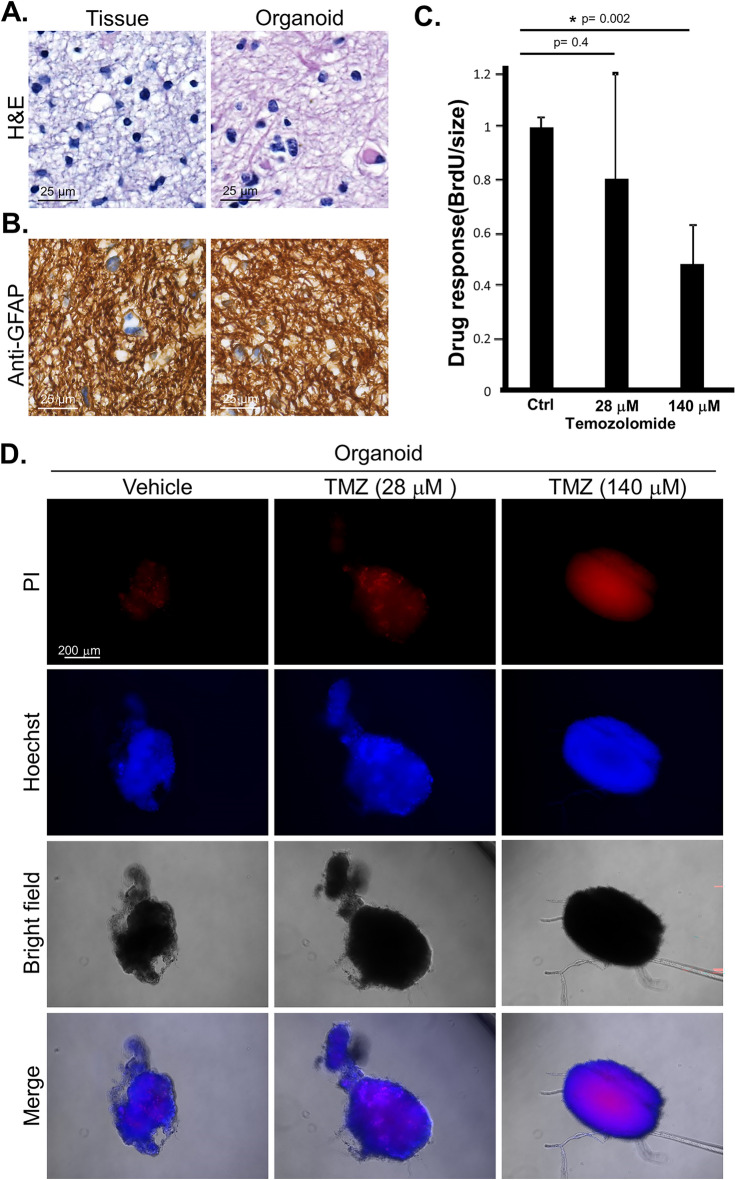
Histology of the tissue section and drug response in patient-derived organoid of patient #3. (A) H&E staining of the source tumor tissue and organoid tissue sections. Scale bar, 25 μm. (B) The sections were stained by immunohistochemistry for glial fibrillary acidic protein (anti-GFAP). Scale bar, 25 μm. (C) The PDOs were treated with temozolomide at the indicated doses converted from the clinical range. The response to the treatment was determined by BrdU incorporation assay measuring DNA replication and normalized by sizes of the organoid (in diameter). (D) Organoids were treated with temozolomide (TMZ) (28 μM and 140 μM) for 48 h. The viability of the cancer cells in the organoid was assessed by staining with Hoechst 33342 and propidium iodide (PI). Scale bar, 200 μm.

