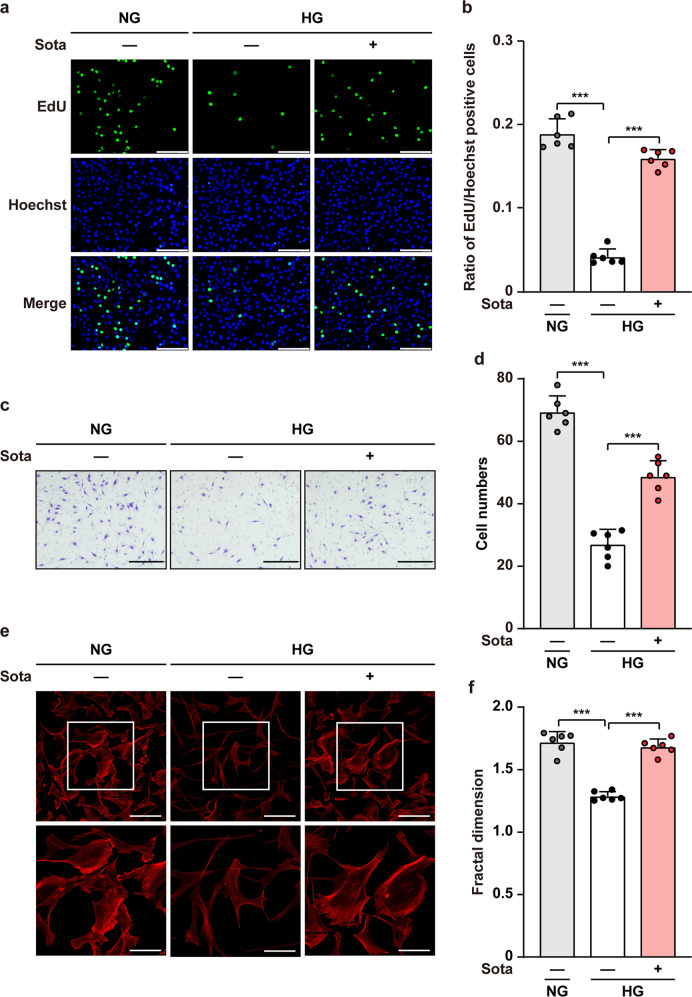
Fig. 3. Sotagliflozin enhances skeletal muscle cells proliferation and migration potentials under hyperglycemia.
a, b Proliferation potential of C2C12 cells treated with 10 μM sotagliflozin under hyperglycemia, as evaluated by EdU incorporation assay. Representative images (a; scale bars: 100 μm) and quantification results (b) were shown. c, d Migration potential of C2C12 cells after 10 μM sotagliflozin treatment, as investigated using transwell migration assay. Representative images (c; scale bars: 200 μm) and quantification results (d) were shown. e, f F-Actin polymerization in C2C12 cells treated with 10 μM sotagliflozin under hyperglycemia, as examined using phalloidin staining. Representative images (e; scale bars: 100 μm for upper panels, 50 μm for lower panels) and quantification of fractal dimension (f) were shown. Data were presented as mean ± SD (n = 6). NG normoglycemia, HG hyperglycemia; ***P < 0.001.

