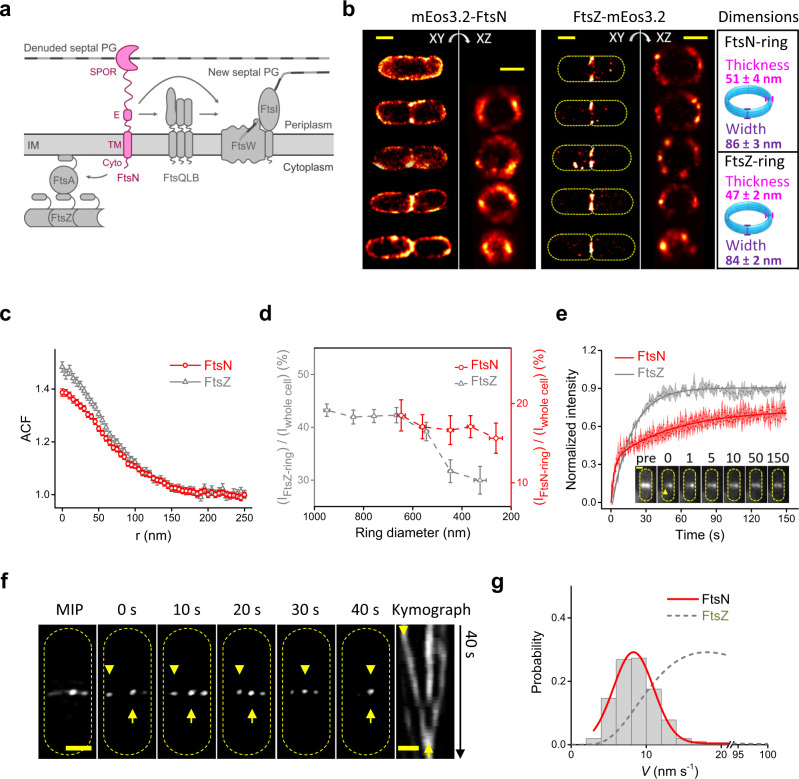
Fig. 1. FtsN-ring has a different organization and dynamics compared to FtsZ-ring.
a Schematic drawing of FtsN’s domain organization and interactions with other divisome proteins. b Three-dimensional (3D) superresolution images show that FtsN-rings (left, mEos3.2-FtsN fusion, Strain EC4443 in Supplementary Table 1) are patchy but more homogenous than FtsZ-rings (middle, data from a previous work30). Yellow dashes mark cell outlines. Scale bars, 500 nm. Toroid ring models (cyan) with the average ring dimensions are shown on the right. c Mean spatial autocorrelation function (ACF) curve of FtsN-rings (red) averaged from all individual cells’ ACFs along the circumference of the ring (r) has lower correlation values at short distances and longer characteristic decay length than FtsZ-ring’s ACF (gray), indicating a more homogenous distribution of FtsN. d Pseudo time course of FtsN’s midcell localization percentages (Iring/Iwhole cell) during cell division suggests that FtsN disassembles later than FtsZ (gray). In (b–d), n = 72 rings for FtsN and n = 103 rings for FtsZ (data from a previous work30). Data are presented as mean ± s.e.m. e Mean FRAP recovery curve of FtsN (red, n = 58 cells, GFP-FtsN, Strain EC4240) exhibits slower and lower recovery than that of FtsZ (gray, data from a previous work36). Error shadow represents standard deviation. Examples of raw FRAP images are shown as inset (also see Supplementary Fig. 7a). Scale bar, 300 nm. f Maximum intensity projection (MIP, left), montages (0–40 s) from time lapse imaging of an mNG-FtsN fusion-expressing cell (Strain EC4564) and the corresponding kymograph (right) imaged using TIRF-SIM. Scale bar, 300 nm. Arrowhead and arrow: a moving cluster and a stationary cluster respectively. g Speed distribution of processively moving FtsN clusters combined from both TIRF-SIM and TIRF imaging (gray columns, 8.7 ± 0.2 nm s−1, μ ± s.e.m., n = 205 clusters) overlaid with the corresponding fit curve (red) and a fit curve of FtsZ’s treadmilling speed distribution (dash gray, data from a previous work40). The x-axis breaks from 21 to 94 nm s−1 to accommodate the distinct speed distributions between FtsN and FtsZ clusters. Source data are provided as a Source Data file.

