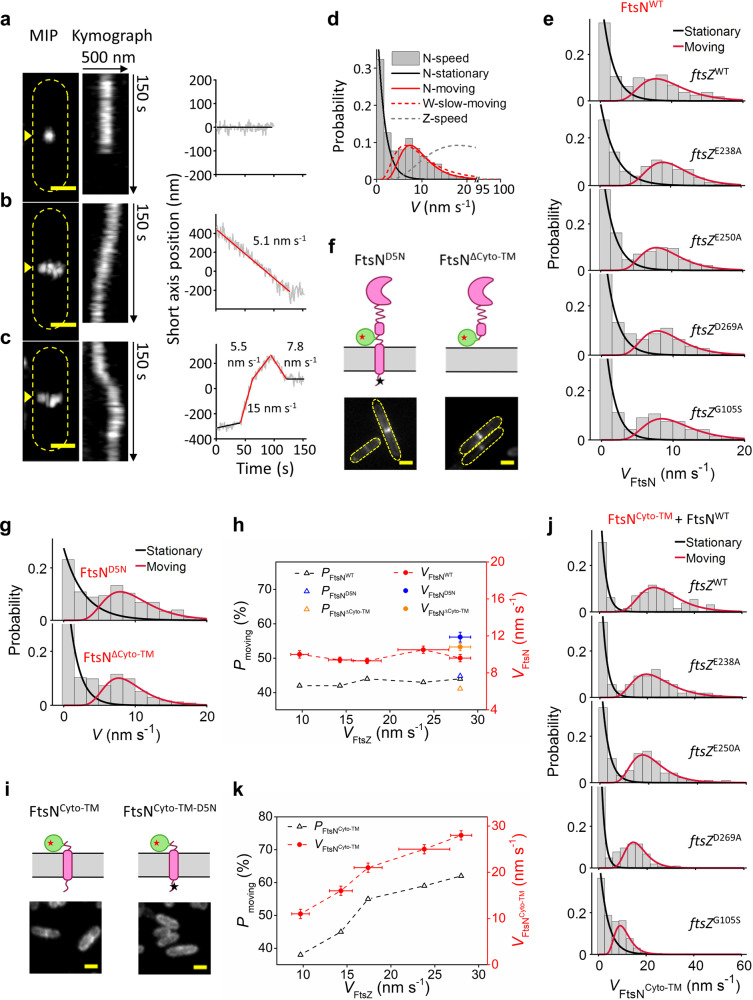
Fig. 2. FtsN exhibits a single processive moving population that is slower than, and independent of, the treadmilling dynamics of FtsZ.
a–c Representative MIPs (left), kymographs (middle) of fluorescence septal line scans (yellow arrow), and unwrapped one-dimensional positions and corresponding linear fits (right) of a stationary FtsN-HaloSW molecule (a), a directionally moving FtsN-HaloSW molecule (b), and an FtsN-HaloSW molecule that transitioned between different directions and speeds (c). Scale bars, 500 nm. Similar images were observed in n > 100 cells. d FtsN’s speed distribution (gray columns) overlaid with the fit curves of the stationary (solid black) and moving (solid red) populations. Dashed curves represent the slow-moving population of FtsW molecules (red, data from a previous work40) and FtsZ’s treadmilling speed distribution (gray, data from a previous work36) for comparison. The x-axis breaks from 22 to 93 nm s−1. e Speed distributions of single FtsN-HaloSW molecules in WT and ftsZ GTPase mutant strains overlaid with corresponding fit curves. f Schematic representation of FtsND5N-HaloSW (left) and Halo-FtsNΔCyto-TM (right) and representative fluorescence cell images (bottom). Green bubble; Halo tag; red star: JF646 dye. Scale bars, 1 µm. Similar images were observed in n > 40 cells for each mutant. g Speed distributions of single FtsND5N-HaloSW (top) and Halo-FtsNΔCyto-TM (bottom) molecules overlaid with corresponding fit curves. h Percentage of moving population (black triangle) and average moving speed (red circle) of FtsN are independent of FtsZ’s treadmilling speed. FtsND5N and FtsN∆Cyto-TM data are shown in blue and orange, respectively. i Schematic representation of FtsNCyto-TM-HaloSW (left) and FtsNCyto-TM-D5N-HaloSW (right) with representative fluorescence cell images (bottom). Scale bars, 1 µm. Similar images were observed in n > 40 cells for each mutant. j Speed distributions of single FtsNCyto-TM-HaloSW molecules in WT and ftsZ GTPase mutant strains overlaid with corresponding fit curves. k Percentage of moving population (black triangle) and average moving speed (red circle) of FtsNCyto-TM are dependent on FtsZ’s treadmilling speed. All data are presented as mean ± s.e.m. The sample sizes of all data points in (h) and (k) are listed in Supplementary Tables 7, 8 and 9. Source data are provided as a Source Data file.

