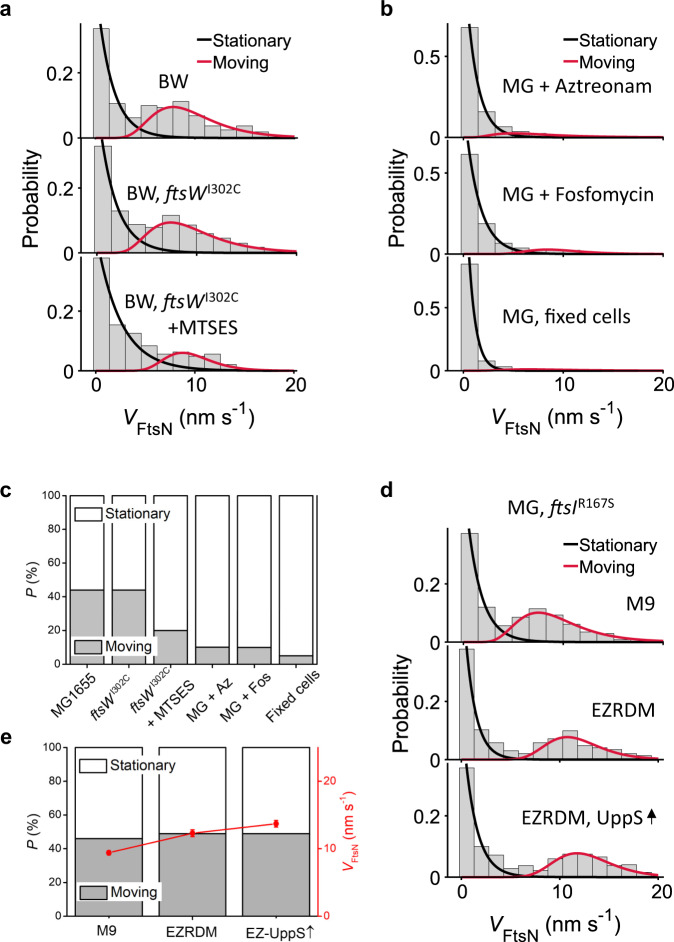
Fig. 3. FtsN’s processive moving population is driven by sPG synthesis activity.
a Speed distributions and the corresponding fit curves of the stationary (black) and moving (red) populations of single FtsN-HaloSW molecules in the BW25113 WT (top) and ftsWI302C variant strain in the absence (middle) or presence (bottom) of MTSES. b Speed distributions of single FtsN-HaloSW molecules in the MG1655 WT strain treated with aztreonam (top) or fosfomycin (middle). Fixed cells without antibiotic treatment are shown as a control (bottom). c Percentage of the processively moving population of FtsN (gray bar) gradually decreased when sPG synthesis is inhibited under the conditions in (a) and (b). d Speed distributions of single FtsN-HaloSW molecules in the MG1655 ftsIR167S superfission variant strain background grown in M9-glucose, EZRDM or in EZRDM medium with UppS overproduction (top to bottom). e Percentage of the processive moving population (gray bar) and average moving speed (red circle) under conditions in (d). The data of average speed are presented as mean ± error, where the error is the standard deviation from 200 bootstrap samples pooled from three independent experiments. The sample size of each point is listed in Supplementary Tables 10. Source data are provided as a Source Data file.

