Figure 1.

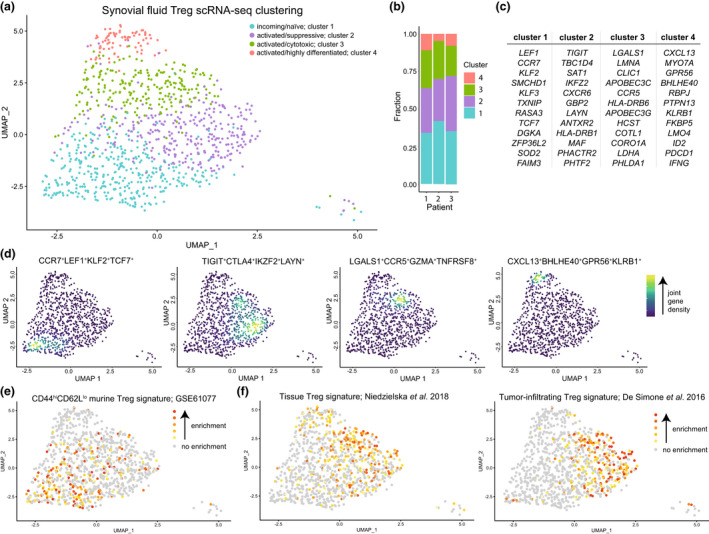
Heterogeneity and phenotypical profile of synovial fluid Tregs. (a) Dimensionality reduction (UMAP) of all synovial fluid (SF)‐derived Tregs (sorted on live CD3+CD4+CD127lowCD25high) of three juvenile idiopathic arthritis (JIA) patients. Tregs are coloured based on the assigned cluster. (b) Reproducible composition of the Tregs across the three included patients. y‐axis: fraction of cells coloured based on the cluster as shown in a and separated per patient on the x‐axis. (c) Top 12 upregulated genes, based on the P‐adjusted value, per cluster based on MAST differential gene expression analysis. (d) UMAPs of the combined expression of 2–4 selected differentially expressed genes per cluster shown in nebulosa density (kernel density estimation to handle sparsity of scRNA‐sequencing data). The scale ranges from blue to yellow, with in yellow the highest kernel density, thus the highest (estimated) expression of all combined selected genes. (e) Gene set analysis of a gene module downregulated in naive versus memory CD4 T cells (GSE61077). Enrichment of a gene set is calculated per cell; grey signifies no enrichment of the gene set and yellow to red represents increasing enrichment. (f) Similar to e, but for a human shared tissue Treg signature 56 and a human tumor‐infiltrating Treg signature. 57
