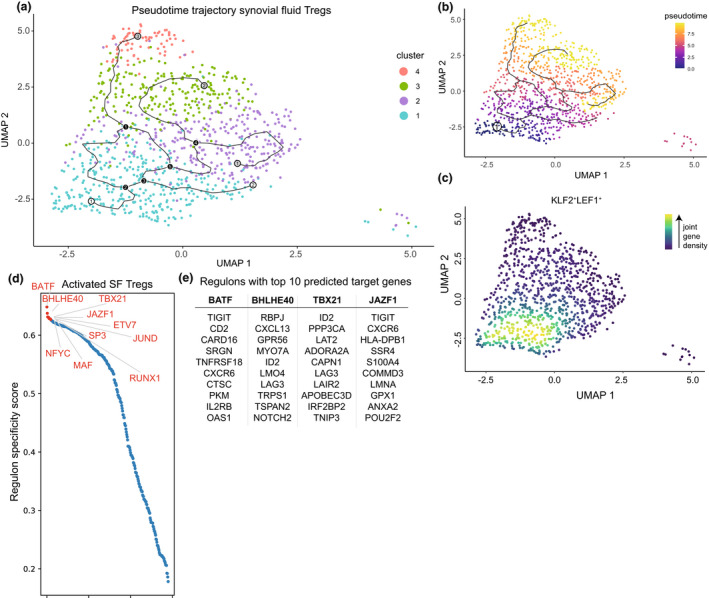
Figure 3.

Predicted differentiation trajectory and regulation of synovial fluid Tregs. (a) Predicted differentiation trajectory of Tregs within the synovial fluid (SF) environment plotted on the UMAP as per Figure 1a. White circles represent predicted starting points, black circles designate decision points setting a cell upon a trajectory, and grey circles (ending in all three activated Treg clusters) depict end points. (b) Similar to a but coloured based on pseudotime with early cells in blue and end stage cells in yellow. The circle with number 1 is the mathematically determined starting node. (c) UMAP of the combined expression of CCR7, LEF1, KLF2 and TCF7 in nebulosa density. The scale ranges from blue to yellow, with the highest kernel density displayed in yellow, thus representing the highest (estimated) expression of all combined selected genes. (d) Top 10 predicted regulons (transcription factor and its target genes) to drive differentiation of cluster 1 to activated cluster 2–4 eTregs. The regulons are ranked by the regulon specificity score for cluster 2–4 Tregs shown on the y‐axis ranging from 0 to 1, with 1 indicating complete specificity of the regulon for the cell type. (e) Selected regulons with their top 10 calculated target genes.
