
Figure 4.
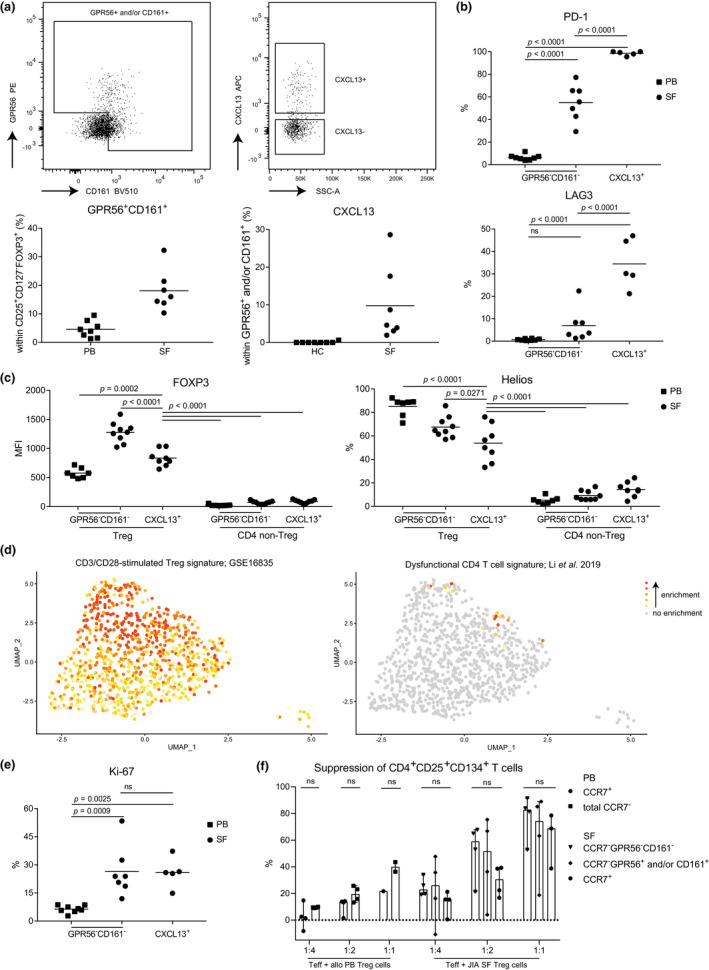
CD161+GPR56+CXCL13+ synovial fluid Tregs are highly differentiated and suppressive. (a) Representative gating (upper row) and quantification (lower row) of GPR56+ and/or CD161+ expression within CD127lowCD25highFOXP3+ Tregs (left) and CXCL13 expression within this subset (left). Quantification is shown in control peripheral blood (PB) Tregs (n = 8) and synovial fluid (SF)‐derived Treg from juvenile idiopathic arthritis (JIA) patients (n = 7). (b) Quantification of PD‐1 (upper) and LAG3 (lower) within control PB GPR56−CD161− (n = 8), synovial fluid (SF) GPR56−CD161− (n = 7) and SF CXCL13+ (GPR56+ and/or CD161+, and CXCL13+; n = 5) Tregs. (c) Quantification of Helios (left) and FOXP3 (right) within control PB GPR56−CD161− (n = 7), SF GPR56−CD161− (n = 9) and SF CXCL13+ (GPR56+ and/or CD161+, and CXCL13+; n = 8) Tregs and CD4 non‐Tregs (CD127+CD25lowFOXP3−). (d) Gene set analysis of a CD3/CD28 stimulated Treg (GSE16835) (left) and a dysfunctional CD4 T cell signature 41 (right). Enrichment is calculated per cell; grey signifies no enrichment and yellow to red shows increasing enrichment. (e) As per b for Ki‐67. (f) Suppression of CD4 effector T cells, assay as per Long et al. 31 Sorted CD3+CD25− T cells (10 000) were cultured with Tregs (CCR7+ (cluster 1), CCR7−, CCR7−GPR56−CD161− (cluster 2–3), CCR7−GPR56+ and/or CD161+ (cluster 4)) derived from control PB or SF of JIA patients in varying ratios (1:4, 1:2, 1:1) to quantify the suppression induced by Tregs. Control PB n = 4, SF n = 3 or 4. Statistical comparisons were performed using Friedman's test. (c, e, f) Data are representative of two independent experiments. (c, e) Statistical comparisons were performed using one‐way ANOVA with Tukey's correction for multiple testing.