Fig. 2.
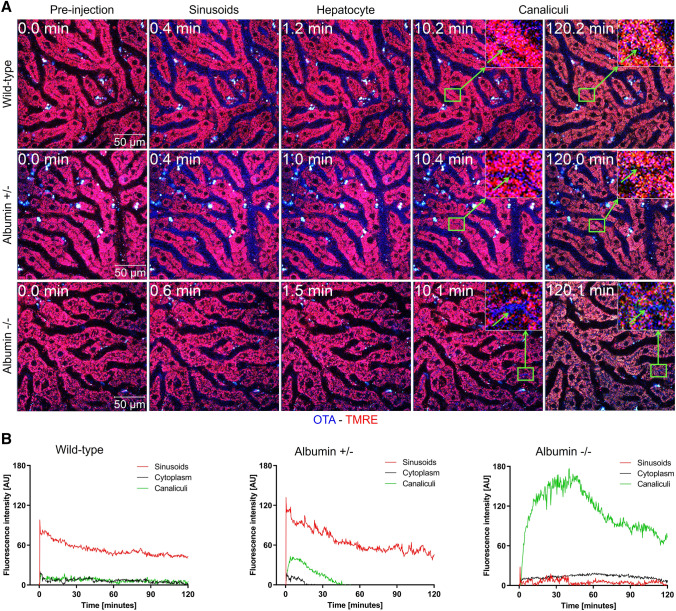
Intravital imaging of OTA transport in the liver. Decreased half-life of OTA in sinusoidal blood, increased intensity in hepatocytes, and increased bile canalicular secretion due to the albumin knockout. A Two-photon imaging of the liver of wild-type, heterozygous (albumin ±), and homozygous (albumin −/−) albumin knockout mice. The time after tail vein bolus injection of 5 mg/kg OTA is given in the upper left corner. The blue OTA-associated signal initially occurs in the blood sinusoids, followed by hepatocyte uptake and bile canalicular secretion. Scale bars: 50 µm; the stills correspond to Supplementary Video 1A-C. B Quantification of the OTA signal in sinusoids, hepatocyte cytoplasm, and bile canaliculi of the three mouse models. The images and quantifications are representative of 3 mice per condition

