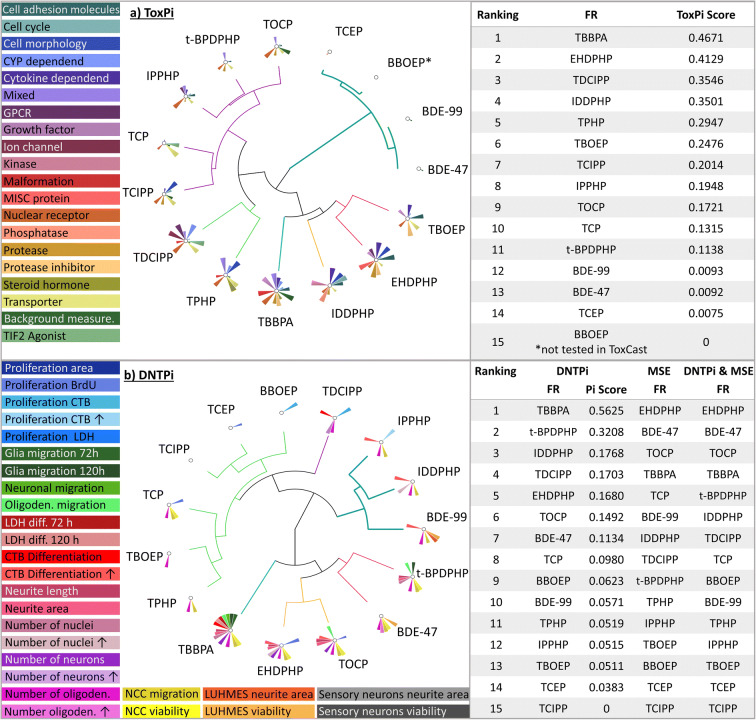
Fig. 7.
Visualization and prioritization of FRs generated with ToxPi. ToxPis for general (a) and DNT-specific (b) toxicities using the ToxCast data and the results of the DNT in vitro battery, respectively. Graphs were produced with the Toxicological Prioritization Index (ToxPi) and Graphical User Interface (GUI) tool version 2.3. Size of pie slices represents relative strength of effect on respective endpoint. For DNTPi and MSE ranking, first priority was given to MSE (Table 1); in the second line, ToxPi ranking was considered, e.g., for compounds with similar MSEs (starting from number 4 in the MSE analysis (Table 1; Suppl. Fig. 5a), due to overlapping 3-fold ranges for the MSE). *BBOEP was not tested in ToxCast

