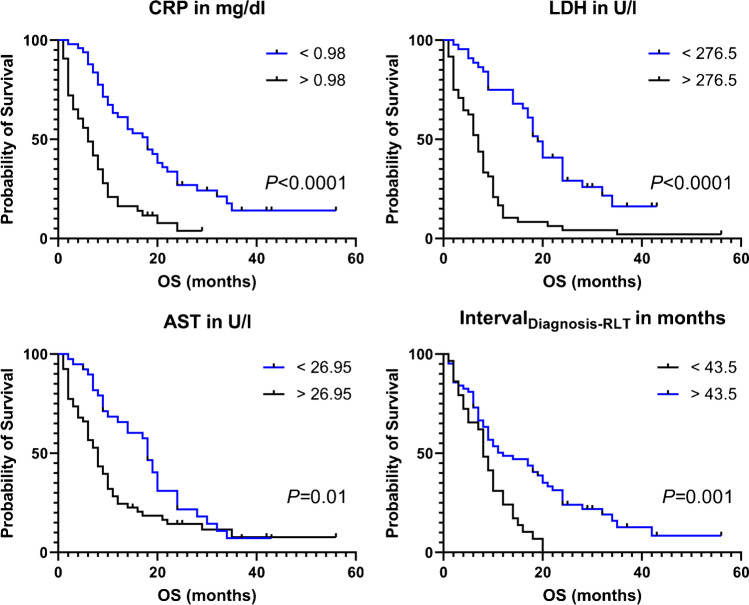
Fig. 3.
Kaplan–Meier curves for patients treated with radioligand therapy stratified into high- and low-risk patients using predefined cutoff values derived by receiver operating characteristics for C-reactive protein (CRP), lactate dehydrogenase (LDH), aspartate aminotransferase (AST), and time interval between initial diagnosis and 1st radioligand therapy (intervalDiagnosis-RLT). Lower baseline CRP, LDH, and AST predicted a significantly longer median OS. In addition, the median OS of patients with a longer intervalDiagnosis-RLT was also prolonged

