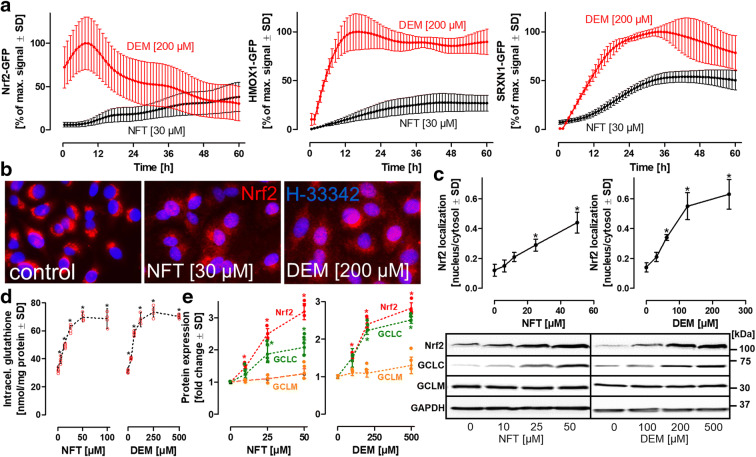
Fig. 2.
Dynamics of cellular oxidative stress response pathway activation. a HepG2 reporter cell lines, expressing green fluorescent protein (GFP)-coupled oxidative stress reporter elements, Nrf2 (nuclear factor erythroid 2-related factor 2), HMOX1 (heme oxygenase), or SRXN1 (sulfiredoxin), were exposed to NFT or to diethyl maleate (DEM) (positive control). Automated high-content confocal imaging and quantitative single cell image analysis were employed for time-resolved monitoring of Nrf2-GFP stabilization and nuclear translocation, as well as for the assessment of the subsequent induction of the downstream targets, SRXN1 and HMOX1. Values are expressed as percentages of the maximal GFP signal detected with DEM (positive control). b For visualization of endogenous Nrf2 stabilization and translocation, wild-type HepG2 cells were treated with NFT or DEM for 24 h, fixed, and stained with an anti-Nrf2 antibody (red). Nuclei were stained with Hoechst H-33342 (blue). c For quantitative assessment of endogenous Nrf2 translocation into the nucleus, a nuclear area and a corresponding cytoplasmic area were defined, and the sum of intensities for all Nrf2 pixels within these areas were used for the calculation of the nuclear/cytosolic ratio for each individual cell. Values are means of 6 independent experiments. In each experiment, a minimum of 1000 cells was analyzed. d Intracellular glutathione levels in HepG2 exposed to NFT or DEM for 24 h. Values are means of 4 independent experiments ± SD. Individual values are represented by red circles. e Protein levels in HepG2 exposed to NFT or DEM for 24 h. Western blotting with antibodies selective for Nrf2, glutamate cysteine ligase catalytic (GCLC), or modifier (GCLM) subunits. Protein levels were normalized to GAPDH levels. Protein levels of untreated controls were defined as unity, and protein levels were expressed in terms of fold change compared to controls. Values are means of 4 independent experiments ± SD. Individual values are represented by colored circles. Differences (c, d) were tested for significance by one-way ANOVA, followed by Bonferroni’s post hoc test, *p < 0.05 for comparison of treatments with the respective untreated controls

