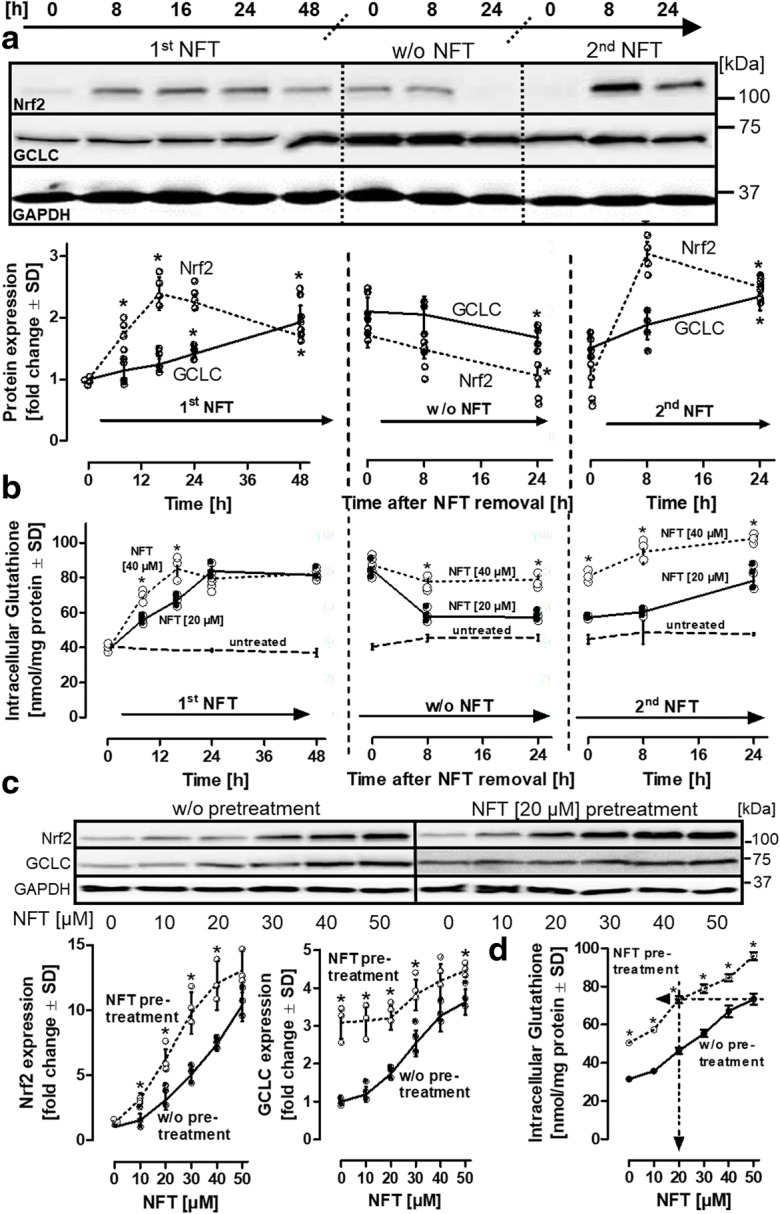
Fig. 5.

Repeated NFT dosing. a HepG2 cells were treated with 20 μM of NFT for different time intervals for up to 48 h (= 1st NFT). Medium was then changed, and the cells were maintained in the absence of NFT for additional 24 h (= w/o NFT). After this period, NFT was re-added, and cells were incubated for up to one day (= 2nd NFT). Medium changes are indicated by the dotted separation lines. Samples were adjusted for equal protein content; western blots were stained for Nrf2 and GCLC. For Western blot quantification, the untreated control bands (t = 0) were normalized to unity, and band intensities were indicated as fold changes related to the respective controls. b Cells were treated with NFT (20 μM or 40 μM) and analyzed for their intracellular levels of glutathione. c HepG2 cells were treated with or without NFT (20 μM) for 48. The cells were then maintained in the absence of NFT for 24 h, followed by the addition of varying concentrations of NFT as indicated for a period of 24 h. Stabilization of Nrf2 and induction of GCLC were analyzed by western blot analysis. d In parallel, intracellular levels of glutathione were determined. The arrows highlight the maximal elevation of intracellular glutathione content, induced by an initial treatment with NFT in comparison to cells that were exposed to NFT pretreatment. Data are means of 4 (a), or 3 (b + c) independent experiments ± SD. Individual values of biological replicates are indicated by dots. In (a), differences were tested for significance by one-way ANOVA, followed by Bonferroni’s post hoc test, *p < 0.05. In (b) and (c), differences were tested for significance by two-way ANOVA (NFT 20 μM vs. 40 μM for individual time intervals), followed by a Bonferroni’s post hoc test *p < 0.05
