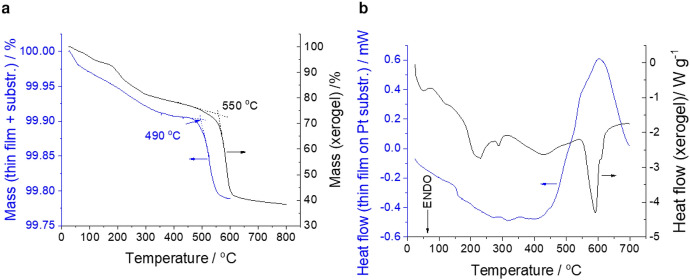
Fig. 12.
Comparison of TG curves (a) and DSC curves (b) of a thin film and corresponding xerogel. For the TG measurement, the films were mounted on microscope coverslips and, after drying, cut into small pieces that could be placed in a crucible. Xerogels with initial mass of about 5 mg were analyzed using the same temperature protocol. The heating rate was 5 K/min. Platinum crucibles of 150 µL were used. During the measurements, the furnace was purged with air (100 mL/min). For DSC measurements, a thin film was applied to the platinum foil (0.7 × 0.7 cm2), dried, and placed directly on the thermocouple. The bare Pt foil served as a reference. Xerogels were weighed into 70-µL Pt pans; in this case, an empty pan served as reference. The same measurement conditions were used as for the TG measurements

