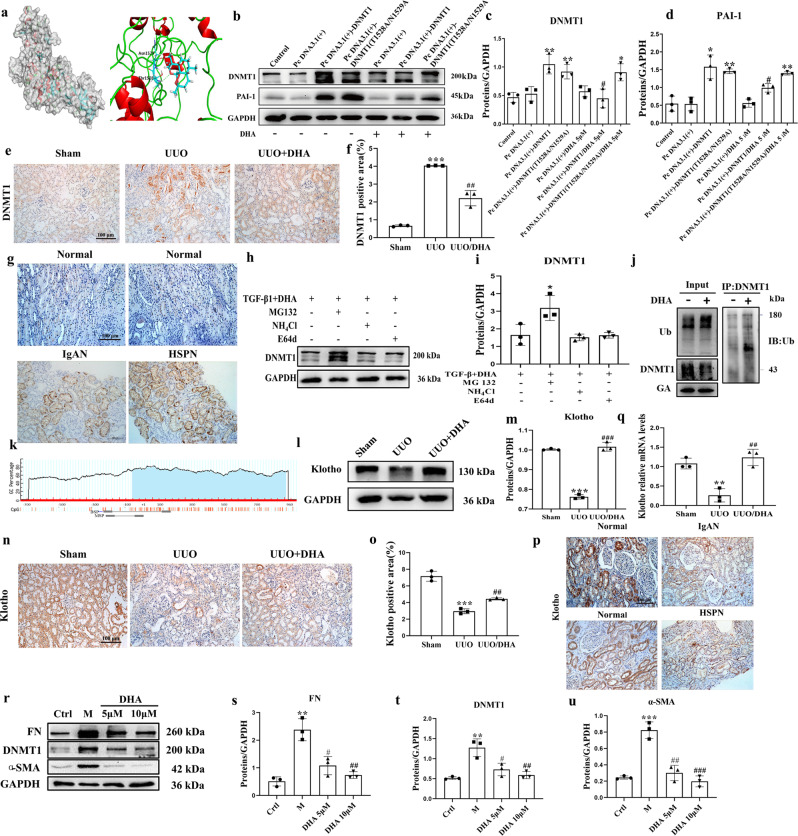
Fig. 3. DHA reduces DNMT1 and enhances Klotho levels.
a Molecular dynamics model of DHA binding to DNMT1. b After transfection of the DNMT1 overexpression plasmid into HK-2 cells for 48 h, the DNMT1 and PAI-1 proteins were detected by Western blotting. c, d Quantification analysis of (b). e, f Immunohistochemical micrographs of DNMT1 in the kidney tissues of mice from each group (scale bar, 100 μm). g Immunohistochemical micrographs of DNMT1 in human kidney tissues. h Representative Western blot analyses of DNMT1 expression are shown in primary mouse renal tubular cells (PRTCs) that were treated with TGF-β (10 ng/mL) and DHA (10 μM) in combination with MG132 (0.5 µM), E64d (10 µg/mL), or ammonium chloride (NH4Cl; 1 mM) for 24 h. i Quantification analysis of 3 g. j DNMT1 and ubiquitin were analyzed by immunoprecipitation with or without DHA. k Schematic diagram of the mouse Klotho promoter. The CpG island is shown in blue. The relative locations of methylation-specific polymerase chain reaction (MSP) and bisulfite-sequencing polymerase chain reaction (BSP) primers are indicated. l, m Protein expressions of Klotho from sham, UUO, and DHA-treated UUO mice as assayed by Western blotting (three samples in each group). n, o Immunohistochemical photomicrographs of Klotho in kidney tissues of mice from each group. p Immunohistochemical photomicrographs of Klotho in human kidney tissues. q Renal expression of Klotho mRNA in different groups was assessed by real-time PCR. r Expression of fibronectin, DNMT1, and α-SMA in primary mouse renal tubular cells (PRTCs) treated with TGF-β (10 ng/mL) in the presence or absence of DHA for 48 h are assayed by Western blotting. s–u Quantification analysis of 3q. The results are the means ± SD of at least three independent experiments. *P < 0.05; **P < 0.01; ***P < 0.001 (compared with sham group or control group); #P < 0.05; ##P < 0.01; ###P < 0.001 (compared with the UUO group or M group).

