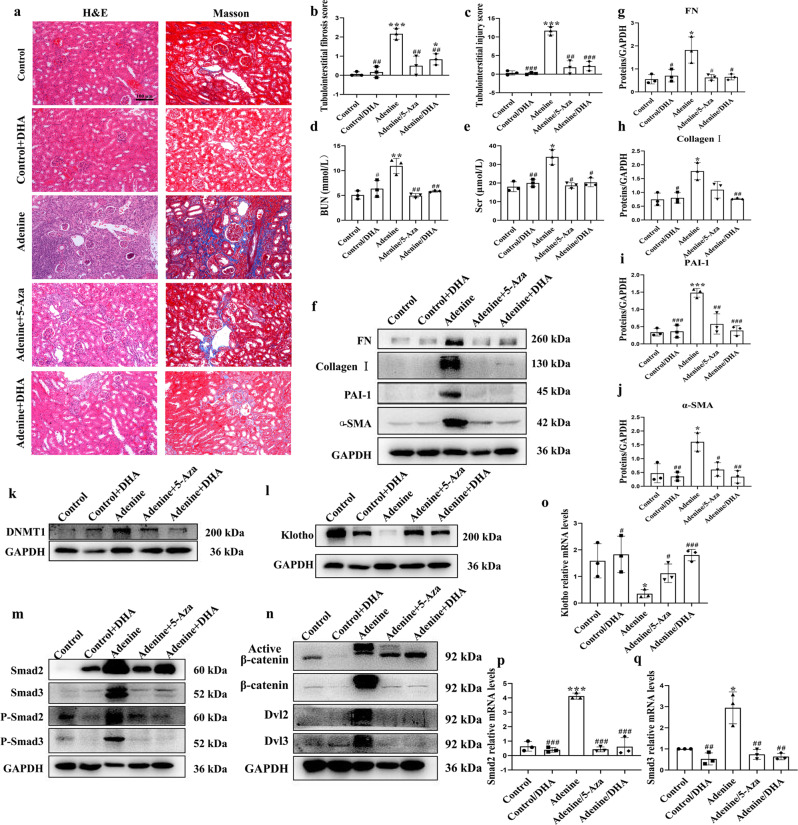
Fig. 5. DHA reversed adenine-induced renal fibrosis in mice (n = 10).
a Representative photomicrographs of the H&E staining and Masson’s trichrome staining of left kidneys from control, DHA, adenine, and 5-Aza or DHA-treated adenine mice (H&E and Masson’s staining; scale bar, 100 μm). b, c Bar graph depicts renal injury scores based on H&E staining. The bar graph depicts renal interstitial fibrosis scores based on Masson’s trichrome staining. d, e Biochemical parameters, including blood urea nitrogen (BUN) and serum creatinine (Scr) of each mouse. f–n Kidney expression of fibronectin, collagen I, PAI-1, α-SMA, DNMT1, Klotho, Smad2, Smad3, phospho-Smad2, phospho-Smad3, active β-catenin, β-catenin, DVL2 and DVL3 from control, DHA, adenine-, and 5-Aza- or DHA-treated adenine mice as assayed by Western blotting (three samples in each group). o–q Renal expression of Klotho, Smad2 and Smad3 mRNA in different groups were assessed by real-time PCR. The results are the means ± SD of at least three independent experiments. *P < 0.05; **P < 0.01; ***P < 0.001 (compared with the control group); #P < 0.05; ##P < 0.01; ###P < 0.001 (compared with the adenine group).

