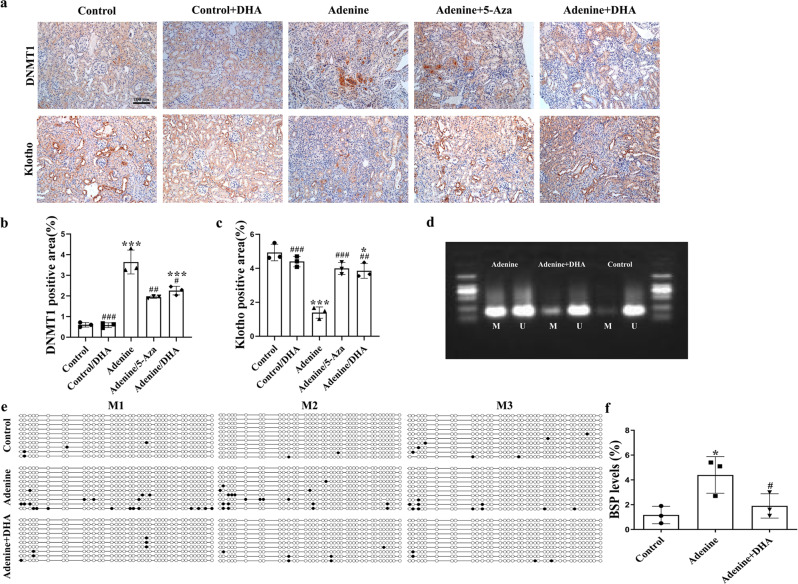
Fig. 6. DHA reverses Klotho promoter hypermethylation in adenine-induced mice.
a Immunohistochemical photomicrographs of DNMT1 and Klotho in kidney tissues of mice in each group (scale bar, 100 μm). b, c Quantification analysis of (a). d MSP analysis of kidney Klotho promoter methylation (Methy) from control, adenine-, and DHA-treated adenine mice (6 weeks, three randomly selected samples in each group). e BSP analysis of kidneys from control, adenine- and DHA-treated adenine mice kidneys (6 weeks). Each box represents the indicated mouse kidney (M); each row of circles in the boxes represents the Klotho CpG island; each dot represents a single CpG site. Open circles indicate unmethylated (Unmethy) CpGs; filled circles indicate methylated CpGs. Each row represents a single sequenced clone (ten clones for each mouse are presented). f Quantification analysis of (e). The results are the means ± SD of at least three independent experiments. *P < 0.05; ***P < 0.001 (compared with the sham group); #P < 0.05; ##P < 0.01; ###P < 0.001 (compared with the adenine group).

