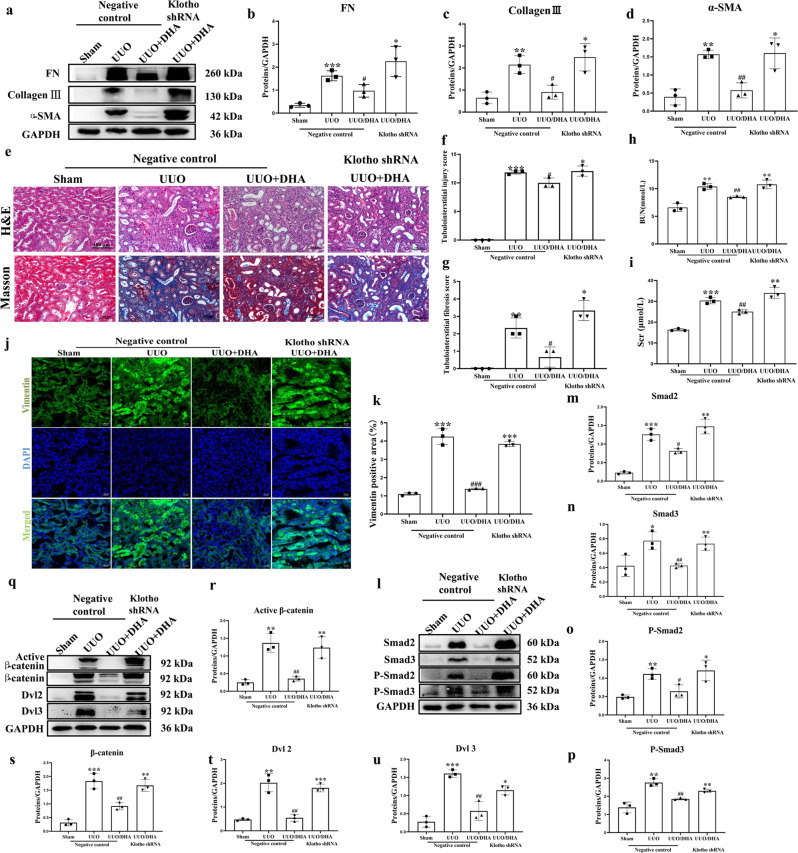
Fig. 8. Klotho is essential for the antirenal fibrotic effect of DHA in UUO mice (n = 6–8).
a The fibrosis-related proteins (fibronectin, collagen III and α-SMA) were measured in different groups of mice by Western blotting (three samples in each group). b–d Quantification analysis of (a). e–g Representative H&E staining and Masson’s trichrome staining of kidneys from different groups of mice (H&E and Masson’s staining; scale bar, 100 μm). h, i Biochemical parameters, including blood urea nitrogen (BUN) and serum creatinine (Scr) of each mouse. j Vimentin staining for the detection of actin filaments in different groups of mice (Scale bar represents 20 µm). k Quantification analysis of (j). l–u Kidney expressions of Smad2, Smad3, phospho-Smad2, phospho-Smad3, active β-catenin, β-catenin, DVL2 and DVL3 from different groups of mice as assayed by Western blotting (three samples in each group). The results are the means ± SD of at least three independent experiments. *P < 0.05; **P < 0.01; ***P < 0.001 (compared with the sham group); #P < 0.05; ##P < 0.01; ###P < 0.001 (compared with the UUO group).

