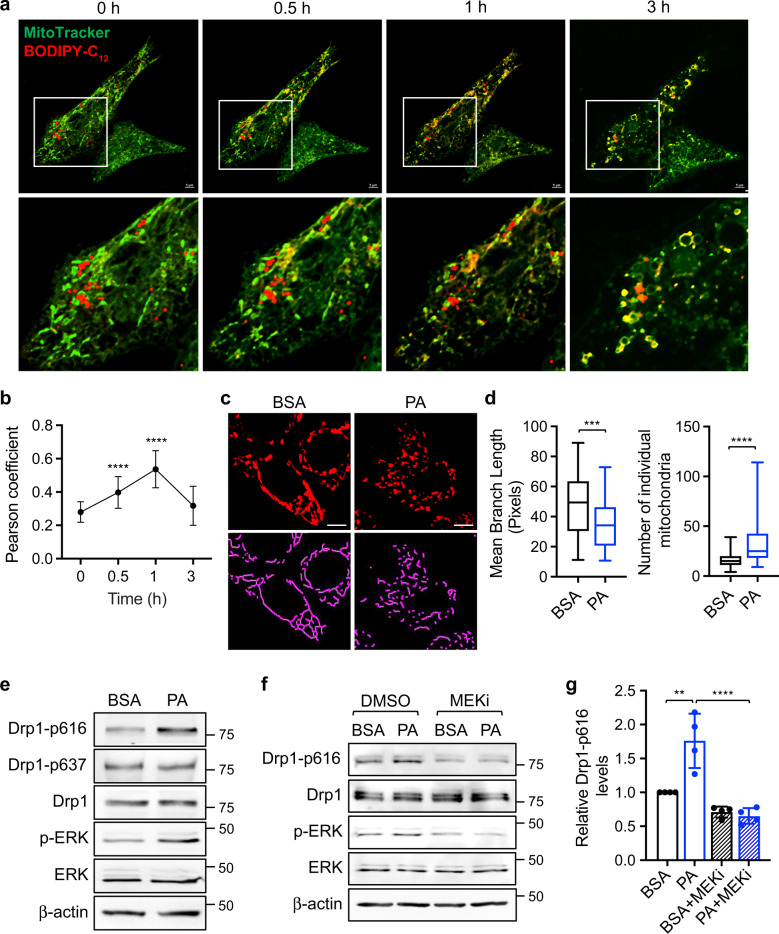
Fig. 1. Fatty acid treatment induces mitochondrial fission in colon cancer cells.
a HCT116 cells were incubated with BODIPY-C12 fluorescent fatty acid (red) and MitoTracker (green) for 1 h. After washing with PBS, the localization of BODIPY-C12 and mitochondria were monitored using live cell imaging. Representative images were taken at indicated time points. The boxed area is enlarged and shown below the corresponding image. Scale bar, 5 μm. b Colocalization of BODIPY-C12 lipid droplets with mitochondria at indicated time points were determined by Pearson coefficient as calculated using NIS-elements AR software (Nikon). Data are presented as mean ± SD (n = 30, ****p < 0.0001). c Representative confocal images of PT130 cells that were treated with BSA or PA and stained with MitoTracker (red). The skeletonized images shown below were generated by the MiNA software and used for the quantitative analysis of mitochondrial morphology. Scale bar, 10 μm. d The length of mitochondrial branch and the number of individual mitochondria were determined using MiNA with ImageJ. Results were presented as box plots (n = 20, ***p < 0.001 and ****p < 0.0001). e PT130 were treated with BSA or PA for 18 h. The levels of Drp1 phosphorylation at S616 (Drp1-p616), and S637 (Drp1-p637), Drp1, phospho-ERK (p-ERK), ERK, and β-actin were determined in cell lysates using western blot. f PT130 cells were treated with BSA or PA in combination with DMSO or trametinib (MEKi) for 18 h. The levels of Drp1-p616, Drp1, p-ERK, ERK, and β-actin were determined using western blot. g Representative western blots as shown in (f) were quantified to determine the relative Drp1-p616 levels by normalizing Drp1-p616 to Drp1. Data were presented as mean ± SD (n = 4, **p < 0.01, and ****p < 0.0001).

