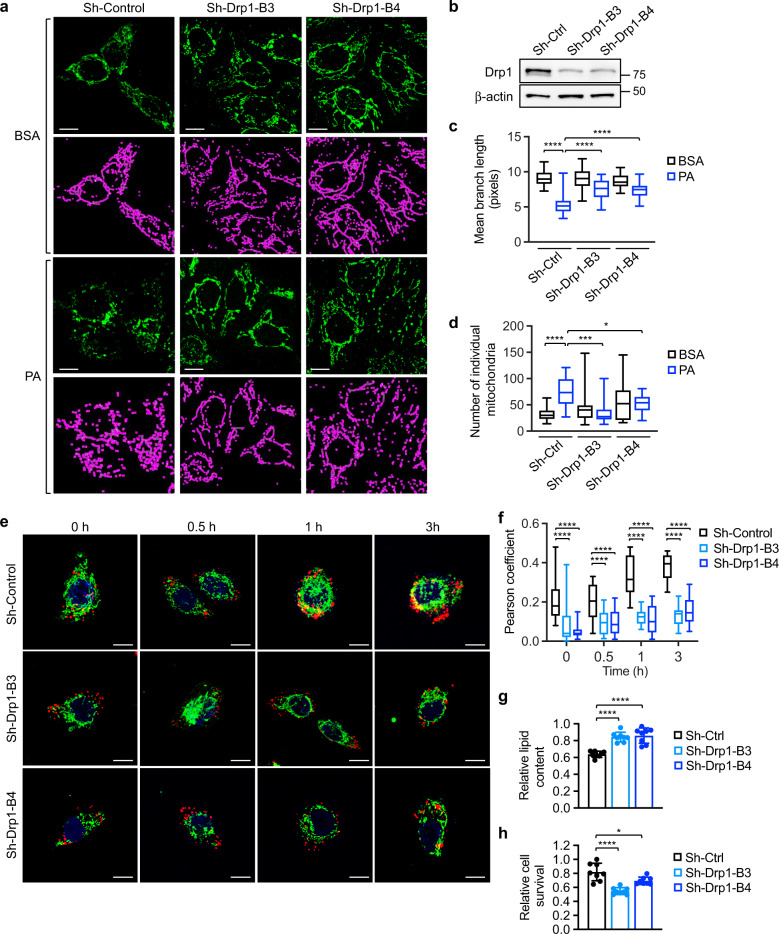
Fig. 3. Knockdown of Drp1 blocks fatty acid-induced mitochondrial fission and fatty acid utilization.
a Control (sh-Ctrl) and two Drp1 knockdown (sh-Drp1-B3 and sh-Drp1-B4) PT130 cells were treated with BSA or PA for 18 h. Representative confocal images were taken of cells stained with MitoTracker Green. The skeletonized images shown below were generated by the MiNA software and used for the quantitative analysis of mitochondrial morphology. Scale bar, 10 μm. b Cell lysates of sh-Ctrl and sh-Drp1 PT130 cells were analyzed for the expression of Drp1 and β-actin using western blot. c The length of mitochondrial branch and d the number of individual mitochondria were determined using MiNA with ImageJ. Results were presented as box plots (n = 20, *p < 0.05, ***p < 0.001 and ****p < 0.0001). e Sh-Ctrl and sh-Drp1 PT130 cells were incubated with BODIPY-C12 (red) and MitoTracker (green) for 45 min and subsequently cultured in DMEM low glucose media supplemented with 10% lipoprotein-deficient serum. Representative images were taken at indicated time points. Scale bar, 10 μm. f Colocalization of BODIPY-C12 with mitochondria was determined using Pearson coefficient as calculated by NIS-elements AR software (Nikon). Results were presented as a box plot (n = 40, ****p < 0.0001). g Sh-Ctrl and sh-Drp1 PT130 cells were incubated with PA for 24 h and subsequently cultured in DMEM low glucose media supplemented with 10% lipoprotein-deficient serum for additional 48 h to allow for lipid utilization. Total cellular lipid contents were determined by BODIPY 493/503 staining. The fluorescence intensity of stained cells was measured using a fluorescence plate reader. Data were presented as mean ± SD (n = 8, ****p < 0.0001). h Sh-Ctrl and sh-Drp1 PT130 cells were loaded with PA and subsequent cultured in EBSS for 48 h. The relative cell survival for each cell line was determined by comparing to cells cultured in regular growth media. Data were presented as mean ± SD (n = 8, *p < 0.05, and ****p < 0.0001).

