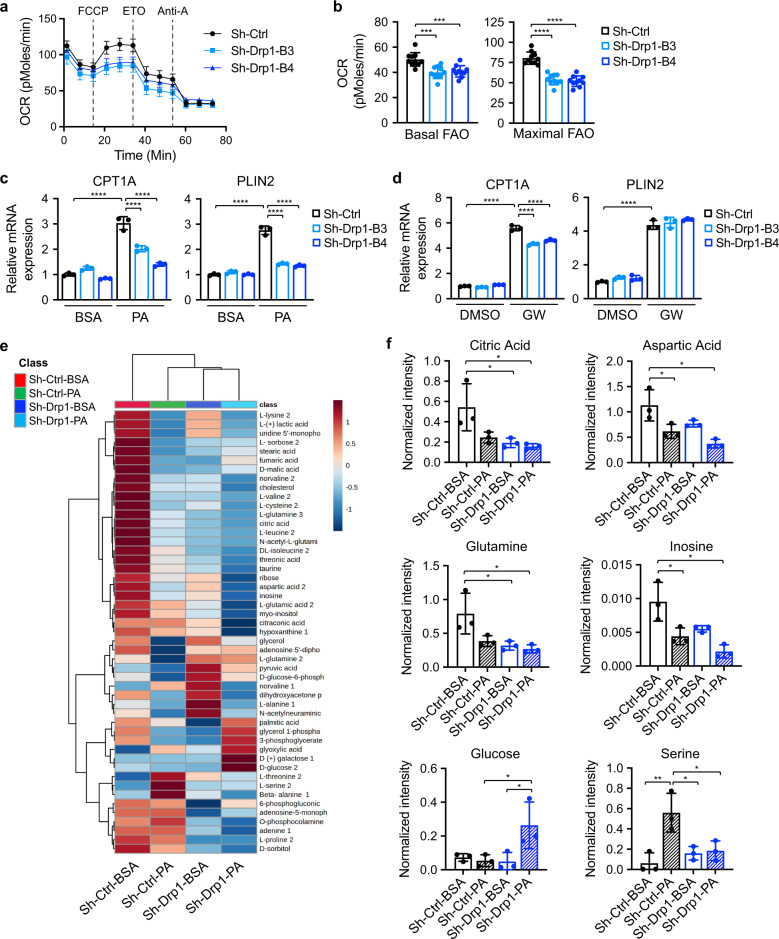
Fig. 4. Knockdown of Drp1 disrupts FAO and alters cellular metabolism in colon cancer cells.
a Sh-Ctrl and sh-Drp1 PT130 cells were cultured in substrate-limited media and subsequently subjected to Seahorse FAO tests using Seahorse XF96 Extracellular Flux Analyzer as described in Materials and Methods. FCCP, ETO, and antimycin A (Anti-A) were added sequentially as indicated by dashed lines. The OCR measurements were normalized to total cell numbers. b Fatty acid-driven mitochondrial respirations were calculated based on OCR measurements and used to reflect basal and maximal levels of FAO. Results were presented as mean ± SD (n = 10, ***p < 0.001 and ****p < 0.0001). c Sh-Ctrl and sh-Drp1 PT130 cells treated with BSA or PA were analyzed for the expression of CPT1A and PLIN2 using RT-qPCR. Data were presented as mean ± SD (n = 3, ****p < 0.0001). d Sh-Ctrl and sh-Drp1 PT130 cells were treated with PPARδ agonist GW501516 (1 μM) for 24 h. The relative expression of CPT1A and PLIN2 was determined using RT-qPCR. Data were presented as mean ± SD (n = 3, ****p < 0.0001). e Sh-Ctrl and sh-Drp1 PT130 cells were treated with BSA or PA for 18 h. Polar metabolites were extracted and analyzed using GC-MS. The heatmap of polar metabolite levels was generated using Metaboanalyst. f Examples of polar metabolites that were differentially regulated in sh-Ctrl and sh-Drp1 PT130 cells. Data were presented as mean ± SD (n = 3, *p < 0.05, and **p < 0.01).

