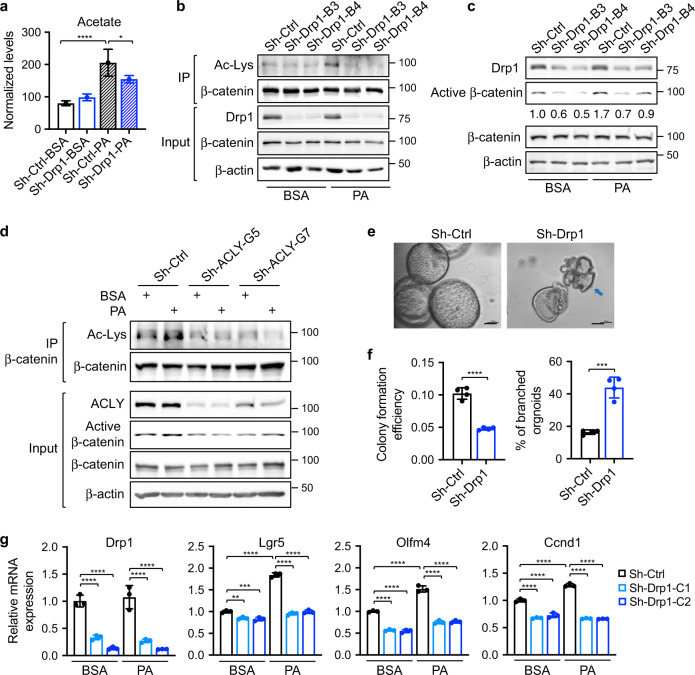
Fig. 6. Downregulation of Drp1 decreases cellular levels of acetate and acetylation of β-catenin.
a Sh-Ctrl and sh-Drp1 PT130 cells were treated with BSA or PA for 18 h. Cellular acetate was extracted and analyzed using GC-MS. Data were presented as mean ± SD (n = 3 for sh-Ctrl-PA group and n = 4 for other groups, *p < 0.05 and ****p < 0.0001). b Cell lysates isolated from sh-Ctrl and sh-Drp1 PT130 cells treated with BSA or PA were immunoprecipitated using the β-catenin antibody. The acetylation of β-catenin was detected by the acetylated-lysine antibody (Ac-Lys). c Sh-Ctrl and sh-Drp1 PT130 cells were treated with BSA or PA for 18 h. GSK3 inhibitor, CHIR99021 (3 μM), was included in both groups to allow the analysis of β-catenin activation downstream of the destruction complex. The expression of Drp1, active β-catenin, total β-catenin, and β-actin were analyzed using western blot. The relative levels of active β-catenin were obtained by normalizing active β-catenin to β-actin. d Sh-Ctrl and sh-ACLY PT130 cells were treated with BSA or PA for 18 h. Cell lysates were immunoprecipitated using the anti-β-catenin antibody and the acetylation of β-catenin were detected using the Ac-Lys antibody. The expression of ACLY, active β-catenin, total β-catenin, and β-actin was detected in the 10% input using western blot. e Representative images of control and Drp1 knockdown Apc/Kras tumor organoids grown in 3D Matrigel for 6 days. Arrow indicates tumor organoid with branched phenotype. Scale bar, 100 μm. f Single cell suspensions of sh-Ctrl and sh-Drp1 tumor cells were seeded in 3D Matrigel. The colony formation efficiency and the percentage of organoids with branched phenotype were quantified. Data were presented as mean ± SD (n = 4, ****p < 0.0001). g Sh-Ctrl and sh-Drp1 tumor organoids were cultured in organoid growth media with the addition of BSA or PA for 2 days. The relative expression of Drp1 and Wnt target genes (including Lgr5, Olfm4, and Ccnd1) was determined using RT-qPCR. Data were presented as mean ± SD (n = 3, **p < 0.01 and ****p < 0.0001).

