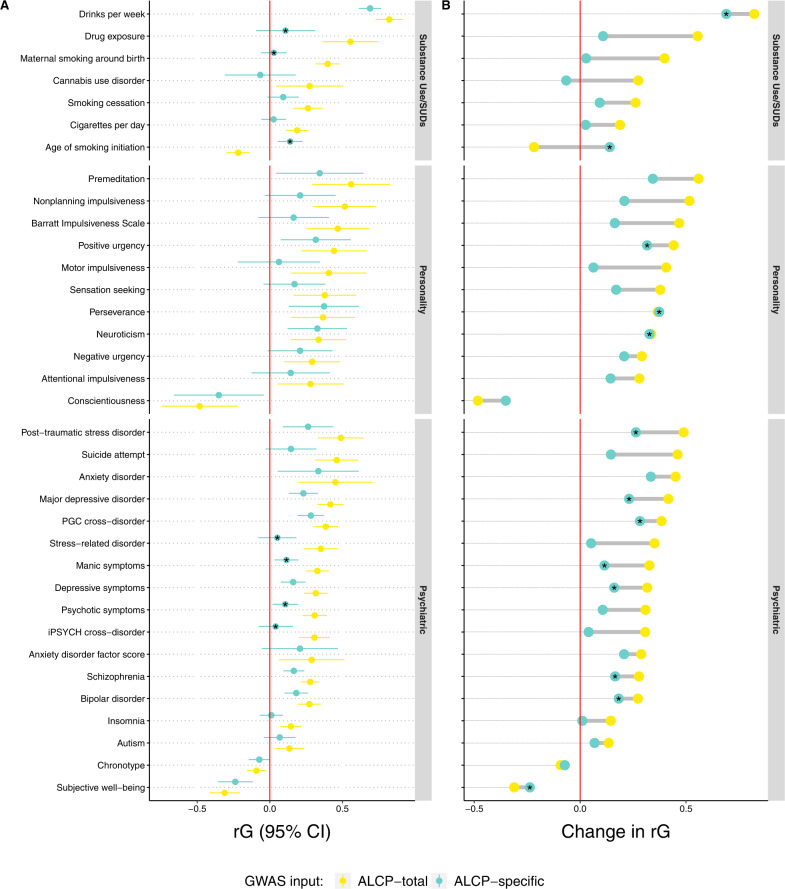
Fig. 2. Values and differences in genetic correlations for ALCP-total and ALCP-specific.
Panel (A) presents the genetic correlations (rg) and 95% CI between problematic alcohol use (ALCP-total, yellow dots), problematic alcohol use-specific (ALCP-specific, teal dots), and selected traits significantly correlated with ALCP-total (after correcting for an FDR of 5%, Supplementary Table 2 reports all preregistered genetic correlations). Asterisks (*) in Panel (A) represent genetic correlations for ALCP-specific that differ significantly from those with ALCP-total. Panel (B) presents changes in point estimates for genetic correlations from ALCP-total to ALCP-specific. In Panel (B), asterisks represent genetic correlations for ALCP-specific that are still significant (after correcting for an FDR of 5%).

