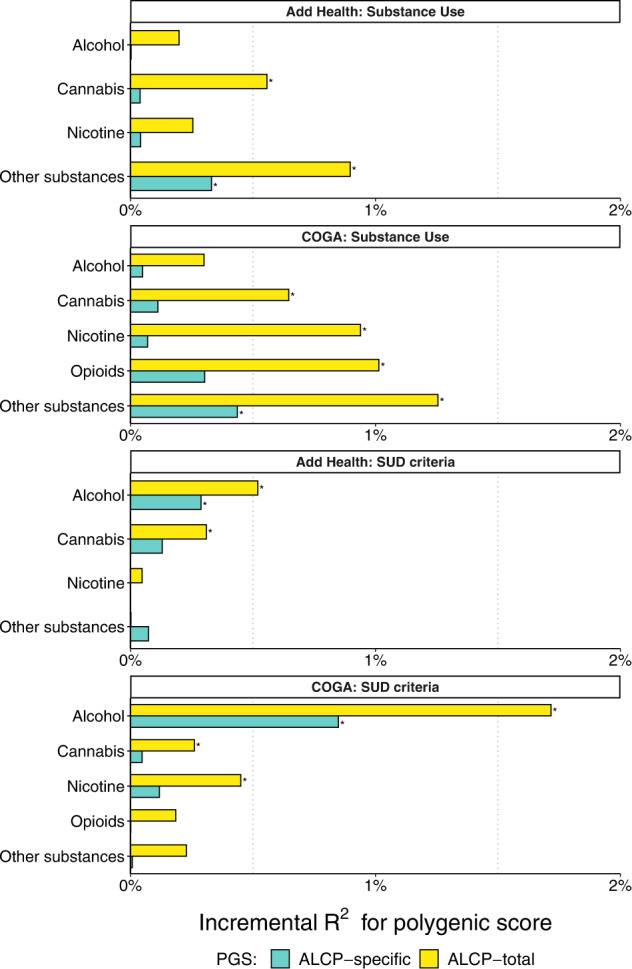
Fig. 3. Polygenic associations with substance use and substance use disorders.

Bar charts illustrating the incremental proportion of variance (incremental R2, or ΔR2 above model with age, sex, PCs, and study-specific covariates) explained by the polygenic score in Add Health (N = 5107) and COGA (N = 7594). Association between polygenic scores and lifetime SUD criterion counts for alcohol, cannabis, nicotine, other illicit substances, and opioids (COGA only). Asterisks (*) represent polygenic scores that are significant after correcting for an FDR of 5%.
