Figure 4.
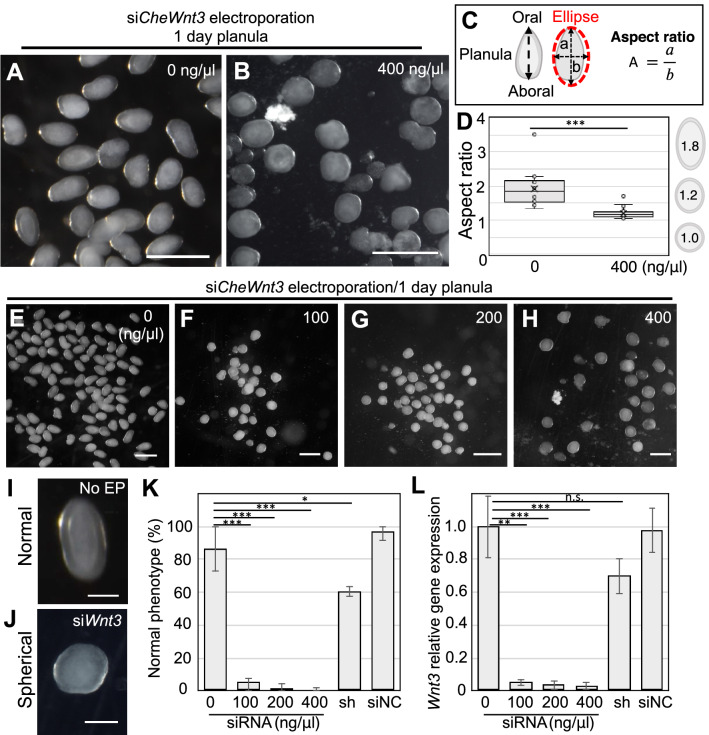
Phenotypes of Wnt3 knockdown with siRNA in Clytia fertilized eggs. (A, B) Typical phenotypes of Clytia 1-day planula. While morphologies of control planula (0 ng/µl) have an elongated oval-shape (A), those of CheWnt3 siRNA (400 ng/µl) are spherical in shape (B). (C) Schematic of ellipse approximation for planula morphology and calculation of the aspect ratio. The aspect ratio was calculated by dividing the long axis (a) by short axis (b). (D) Boxplots showing the aspect ratio of the 1-day planula. Center lines show the medians; x’s denote the mean values; box limits indicate the 25th and 75th percentiles; whiskers show maximum and minimum values; inner points and outliers are represented by circles. Number of examined planula: 0 ng/µl, n = 127; 400 ng/µl. n = 25, ***p < 0.001. (E–H) Phenotypes of 1-day planula after siRNA targeting CheWnt3 electroporation (0, 100, 200, and 400 ng/µl siCheWnt3). (I and J) For morphology quantification, we classified planula phenotypes into two categories: elongated oval shape as “normal” and spherical (circle) shape as “spherical”. (K) Bar plots show the percentage of normal phenotypes across four different siRNA doses as well as planulae treated with shRNA and siNC, a siRNA universal negative control. Percentages are the mean value and error bars indicate standard deviation. Numbers of examined planula: 0 ng/µl, n = 127; 100 ng/µl, n = 75; 200 ng/µl, n = 86; 400 ng/µl, n = 95. shRNA 400 ng/μl, n = 288; siNC 400 ng/μl, n = 45. Experiments were repeated three times. Error bars: maximum and minimum values. p-values: 100 ng/μl, p = 0.000599; 200 ng/μl, p = 0.000438; 400 ng/μl, p = 0.000402; 400 ng/μl of shRNA, p = 0.031928; 400 ng/μl of siNC, p = 0.283359. *p < 0.05, ***p < 0.001. (L) Quantification of CheWnt3 mRNA levels of 1-day planula by RT-qPCR. CheEF1alpha was used as an internal control. Bar heights represent the mean value. CheWnt3 expression levels are standardized relative to the control (0 ng/µl). Error bars: standard deviation. p-values: 100 ng/μl, p = 0.00799; 200 ng/μl, p = 0.000754; 400 ng/μl, p = 0.000733; 400 ng/μl of shRNA, p = 0.095403; 400 ng/μl of siNC, p = 0.900264. **p < 0.01, ***p < 0.001. n.s., not significant. Experiments were performed in triplicate and repeated at least three times. Scale bars: (A, B, E–H) 400 µm, (I, J) 100 µm.

