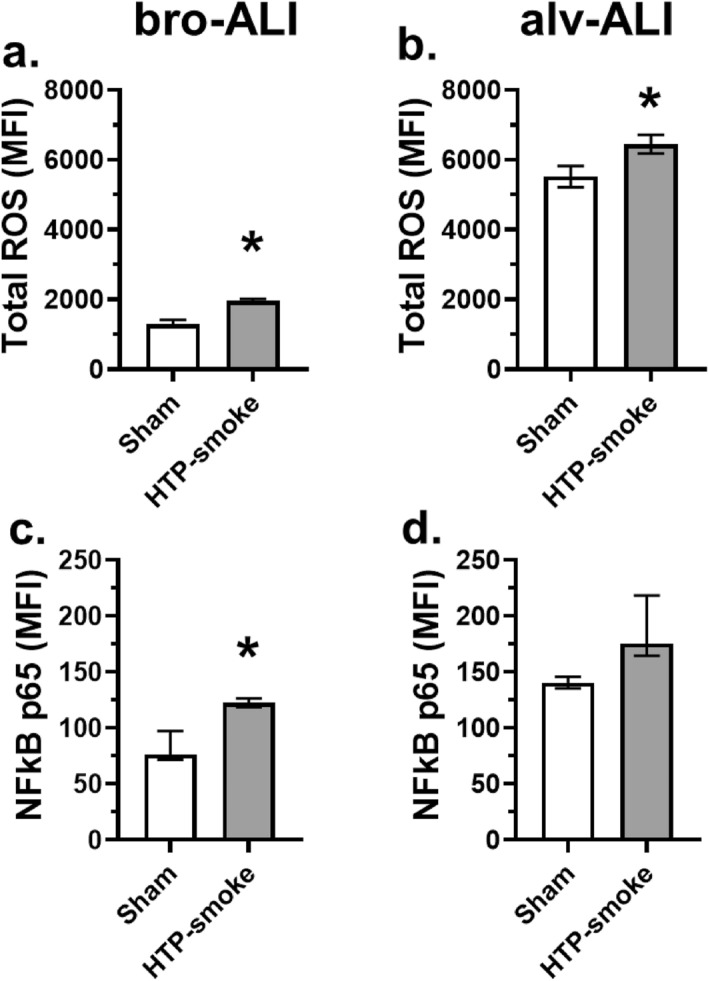
Figure 2.

Assessment of oxidative stress response by measurement of (a, b) total cellular reactive oxygen species (ROS) and (c, d) expression of nuclear factor kappa-light-chain-enhancer of activated B cells (NFkB) p65 subunit by flow cytometry in sham exposed and HTP-smoke exposed bro-ALI and alv-ALI models. Data are shown as medians and interquartile ranges. n = 6 per exposure condition; non-parametric statistical analysis (Wilcoxon signed rank test), *p < 0.05. ALI: air–liquid interface; alv-ALI: alveolar mucosa model at ALI; bro-ALI: bronchial mucosa model at ALI; HTP: heated tobacco product, MFI: mean fluorescent intensity.
