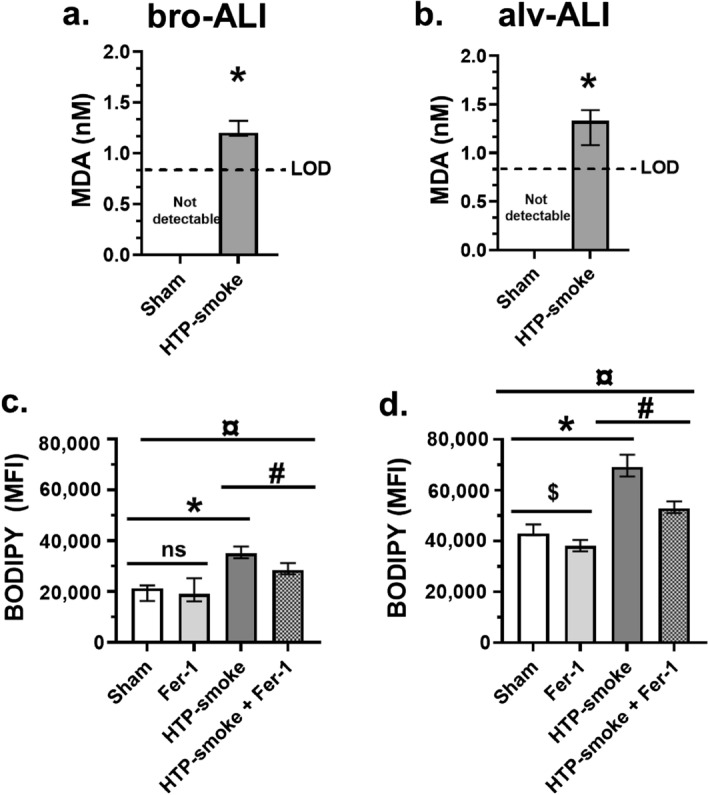
Figure 8.

Assessment of lipid peroxidation levels in the bro-ALI and alv-ALI models due to sham exposure and HTP-smoke exposure. (a, b) Colorimetric malondialdehyde (MDA) assay and (c, d) BODIPY 581/591 C11 (Lipid Peroxidation Sensor) assay using ferrostatin-1 by flow cytometry. Data are shown as medians and interquartile ranges. n = 6 per exposure condition; non-parametric statistical analysis (Wilcoxon signed rank test or Friedman test followed by Wilcoxon signed rank test, as appropriate); ns: not significant; #,¤,$,*p < 0.05. MDA levels were below the limit of detection (LOD) in both bro-ALI and alv-ALI sham samples. Therefore, a value just below the LOD (0.85 nM) of MDA is assigned to all the sham samples for statistical analysis. ALI: air–liquid interface; alv-ALI: alveolar mucosa model at ALI; bro-ALI: bronchial mucosa model at ALI; Fer-1: ferrostatin-1; HTP: heated tobacco product; MFI: mean fluorescent intensity.
