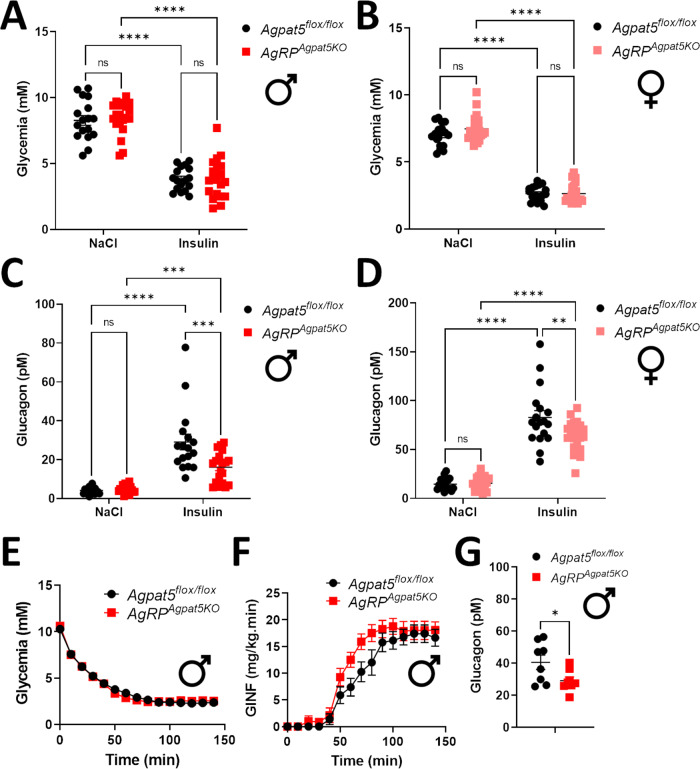
Fig. 2. AgRPAgpat5KO mice display reduced hypoglycemia-induced glucagon secretion.
A, B Glycemia in Agpat5flox/flox mice and AgRPAgpat5KO mice one hour after NaCl or insulin injection; A male mice, B female mice. Plasma glucagon levels one hour after NaCl or insulin injection in Agpat5flox/flox and AgRPAgpat5KO mice C male mice, D female mice. A–D Two independent cohorts, n = 18–22 mice per genotype. Data are mean ± SEM, two-way ANOVA, *** p < 0.001 and ****p < 0.0001, two-way ANOVA with Tukey’s multiple comparisons correction. E–H Hyperinsulinemic-hypoglycemic clamps performed in Agpat5flox/flox mice and AgRPAgpat5KO male mice: E Glycemic levels. F Glucose infusion rates. Data are mean ± SEM, (repeated measurements) with Sidak’s multiple comparisons correction. G Plasma glucagon levels at the end of the clamp. Data are mean ± SEM, n = 8 mice. *p < 0.05, two-tailed, unpaired Student’s t-test.

