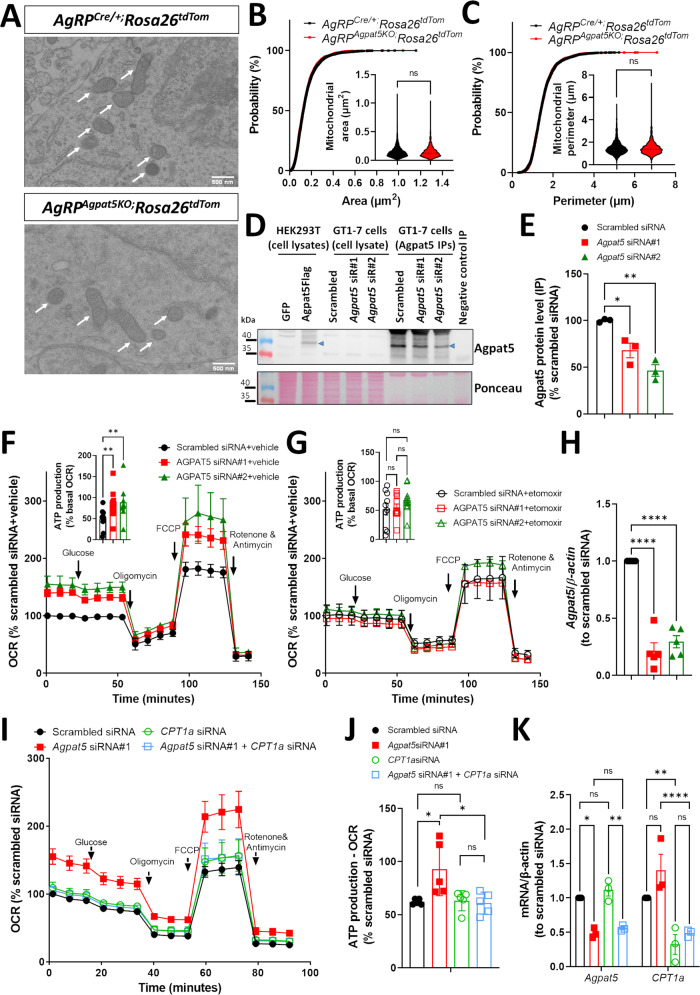
Fig. 5. Agpat5 inactivation does not modify mitochondria dynamics but increases ATP production.
Mitochondria morphology was analyzed in AgRP neurons of AgRPCre/+;Rosa26tdTom mice and of AgRPAgpatKO;Rosa26tdTom littermate mice in ad libitum fed state. A Electron microscopy pictures of AgRP neurons of AgRPCre/+;Rosa26tdTom mice and AgRPAgpatKO;Rosa26tdTom mice. AgRP neurons were identified by correlative light and electron microscopy. B Cumulative distribution of mitochondria areas. C Cumulative distribution of mitochondria perimeters,3 mice per genotype; 90 AgRP neurons; 2424–2491 mitochondria. Scale bar, 500 nm. Two-tailed, paired Student’s test. Western blot analysis of Agpat5 expression in GT1-7 cells transfected with a scrambled or two different Agpat5-specific siRNAs. D Detection of Agpat5 by immunoprecipitation followed by immunoblotting with the Agpat5 antibody. Lysates of HEK293T cells transfected with a GFP or an Agpat5GFP expression plasmid served as negative and positive controls for Agpat5, respectively. E Quantification of Agpat5 expression. n = 3 replicates. Data are mean ± SEM, *p < 0.05, **p < 0.01, one-way ANOVA with Dunnett’s multiple comparisons correction. Oxygen consumption rates (OCR) and ATP production (defined by difference between basal OCR and OCR after blocking ATP synthase with oligomycin) were measured in GT1-7 cells transfected with scrambled or Agpat5-specific siRNAs. The role of β-oxidation in ATP production was verified using the CPT1a inhibitor etomoxir or by siRNA-mediated Cpt1a silencing, n = 9–10 biological replicates. Data are mean ± SEM, *p < 0.05, one-way ANOVA with Tukey’s post hoc test. F OCR in GT1-7 cells in the absence of etomoxir and quantification of ATP production by cells. G OCR in GT1-7 cells in the presence of etomoxir and quantification of ATP production by cells. H PCR quantification of Agpat5 expression, n = 5 replicates. Data are mean ± SEM, ****p < 0.0001, one-way ANOVA with Dunnett’s multiple comparisons correction. I OCR in GT1-7 cells transfected with the scrambled siRNA, an Agpat5 siRNA, and/or a Cpt1a siRNA. J Quantification of ATP production by cells in (I), n = 5 biological replicates, n = 5 technical replicates per assay. K PCR quantification of Agpat5 and Cpt1a expression in cells used in (J), n = 3 biological replicates. J, K Data are mean ± SEM, *p < 0.05, **p < 0.01, ***p < 0.001 and ****p < 0.0001, two-way ANOVA with Tukey’s multiple comparisons correction.

